Download
1 / 18
180 likes | 451 Views
Investigating Synoptic Variations in Atmospheric CO2 Using Continuous Observations and a Global Transport Model. Nicholas Parazoo, Scott Denning, Randy Kawa, Ravindra Lokupitia 8 th TransCom workshop program (v3) April 24 th -27 th , 2007. Synoptic Variations.

E N D
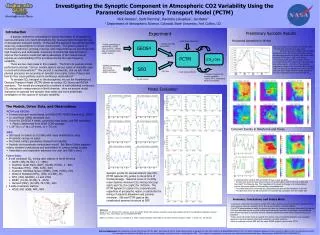
Investigating Synoptic Variations in Atmospheric CO2 Using Continuous Observations and a Global Transport Model Nicholas Parazoo, Scott Denning, Randy Kawa, Ravindra Lokupitia 8th TransCom workshop program (v3) April 24th-27th, 2007
Synoptic Variations • Large day-to-day variations likely associated with transport events such as cold fronts • Synoptic variations contain upstream source/sink information -> target cold fronts
Experimental Design • Fossil Fuels, Ocean Flux • Assimilation of radiosondes, aircraft measurements, satellite data (precipitable water, surface winds) • Physics determined from NCAR CCM3 • Winds, cloud mass fluxes, PBL Parameters Weather Reanalysis (GEOS4) • Forward Transport Model • 6-hourly Transport Model (PCTM) [CO2] OBS • Vegetation Indices • Biome type • Soil properties • Weather Reanalysis • Lin and Rood (1996) dynamical core • 1.25°x1°,t=7.5m • 3 year spinup (2000-02) Land Surface Model (SiB) • Terrestrial CO2 surface flux • Model Evaluation • 12 year spinup • Hourly
Frontal Identification (water vapor) wind direction Frontal Locator Function • The time at which magnitude of gradient of changes the most rapidly defines the trough (minimum GG) and ridge (maximum GG) • Apply to reanalysis, retain events with minima in both water vapor and temperature • Filter out events without clockwise wind shift or pressure minimum pressure GG Cold Front!
Frontal CO2 Composites • Multiple cold fronts averaged together (diurnal & seasonal cycle removed) • Error bars are sd of ave • Unique patterns, shape and phase match observations • Amplitude mismatch • Upstream sinks/sources? • Vegetation stress? • Improper response to frontal weather?
Why do large day-to-day variations of 10-20ppm exist during frontal passage?
Large Scale Influence Correlation Coefficient • Run 1: Global surfaces fluxes • Run 2: Eastern Hemisphere surface fluxes only • Correlation of the 2 Runs in July (mid-day values only) shows the importance of lateral flow over NA (R2 = 35-70% in SE!)
Horizontal Transport is Key Mid-day [CO2] LEF FRS • Horizontal transport suggested in coherent events • Transport acts on gradients • How are gradients established? Aug 27 Aug 28 OBS PCTM SGP WKT July 18 July 19
Time Mean [CO2] Gradients July Average PCTM [CO2] at 50m • In the Midwest, ignoring fossil fuels, weak gradients in the time mean • dC/dx ~ 1-3ppm/3-5°
Deformational Flow PCTM [CO2] at 50m gradient strength • Anomalies organize along cold front • dC/dx ~ 10-15ppm/3-5° • shear • deformation • tracer field • rotated by • shear vorticity • stretching • deformation • tracer field • deformed • by stretching
PBL CO2 Budget • Time rate of change of [CO2] in the PBL due to transport and surface fluxes, daytime only • Average local biogenic and fossil fuel flux • Advection by vertical wind, w = -w/(rg), w derived from mass flux divergence • Advection by horizontal wind • PBL transport by moist convective mass fluxes Bakwin et al., 2004
Monthly Budget DC/DT (Model) DC/DT (Budget) • Monthly average 1-hr tendencies (daytime only) • Pattern and sign match, magnitude error in some places • Horizontal advection negligible (except near cities) • Monthly average 1-hr tendency reflection of uptake east of Rockies and cloud transport in SE Cloud Transport Vertical Advection Horizontal Advection Surface Flux
Budget for Frontal Case DC/DT (Model) DC/DT (Budget) • All terms important, including horizontal advection • Transport biggest driver along front • Balance between vertical advection and surface flux behind Cloud Transport Vertical Advection Horizontal Advection Surface Flux
Conclusions • Phase of synoptic [CO2] is good, but amplitude too strong • Synoptic variations of CO2 caused by deformational flow along fronts • Regional models need to properly account for large scale inflow at boundaries • Monthly PBL balance is between biology & vertical mixing • Synoptic PBL balance also strongly affected by horizontal advection
Thanks to the following for continuous CO2 data: Ken Davis, Arlyn Andrews, Sebastien Biraud, Doug Worthy, Bill Munger, NOAA-GMD • This Research is funded by NASA Contracts #NNX06AC75G and #NNG05GD15G and NOAA Contract #NA17RJ1228 Amend. 97
Performance of Frontal Locator Oklahoma Wisconsin Canada • Events identified in the reanalysis match observations in shape and phase • Mismatch of magnitude of water vapor at northern sites • Events not classified in terms of other weather (ppt, radiation, etc.) Wind Direction Wind Speed Surface Pressure Water Vapor Temp
Synoptic CO2 Variations • Regression of transport model onto continuous observations • 2004 only, seasonal cycle removed • R2 from 17-39% • Good agreement, some room for improvement of surface fluxes and/or transport PCTM Observations