Download
1 / 12
120 likes | 261 Views
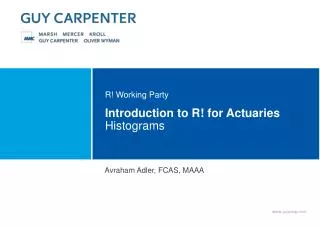
R! Working Party. Introduction to R! for Actuaries Histograms. Avraham Adler, FCAS, MAAA. Introduction to R! for Actuaries Histograms. It is often useful to view histograms of loss severity on both regular and logged scales There are many ways to do so using R!

E N D
R! Working Party Introduction to R! for ActuariesHistograms Avraham Adler, FCAS, MAAA
Introduction to R! for ActuariesHistograms • It is often useful to view histograms of loss severity on both regular and logged scales • There are many ways to do so using R! • Following are two methods, one using the MASS package and the other using the more sophisticated ggplot2 package • R! code will be displayed in Courier New font, and can be copied directly into R! to generate results • R! text outputs will be displayed in blue-colored Courier New
HistogramsGenerating losses • For demonstration purposes, the actuar package will be used to generate a suite of losses • Fixing the initial random seed ensures reproducibility • set.seed(216) • library(actuar) • Claims<-rgenpareto(n=1000, shape1=2.7, shape2=1.4, scale=1e6) • summary(Claims) Min. 1st Qu. Median Mean 3rd Qu. Max. 1905 175900 417100 843900 932800 35240000
Using MASSIntroduction and R! Code • The MASS package has some simple, but useful formulæ to generate histograms • library(MASS) • par(mfrow=c(2,1)) • truehist(Claims) • lines(density(Claims), col="red", lwd=2) • truehist(log10(Claims)) • lines(density(log10(Claims)), col="red", lwd=2)
Using ggplot2Introduction • The ggplot2 package is both much more complicated and powerful • ggplot2 requires data frames and not merely vectors • The initial “plot” is created, and then layers are added or adjusted • Viewports are used to show multiple plots on the same device • The plot including histogram and density will be created first, and then a new scale can be overlaid on it for the second version
Using ggplot2R! Code • library(ggplot2) • ClaimsDF<-data.frame(Claims) • Hist<-ggplot(ClaimsDF, aes(x=Claims)) • Hist1<-Hist + geom_histogram(aes(y=..density..), colour="black", fill="dodgerblue") + stat_density(color="red", size=1, geom="line") • Hist2<-Hist1+scale_x_log10() • vplayout <- function(x, y) viewport(layout.pos.row=x, layout.pos.col=y) • grid.newpage() • pushViewport(viewport(layout=grid.layout(2,1))) • print(Hist1, vp=vplayout(1,1)) • print(Hist2, vp=vplayout(2,1))
HistogramsReferences • Dutang, C.; Goulet, V. & Pigeon, M. “actuar: An R Package for Actuarial Science.” Journal of Statistical Software (2008) • R Development Core Team. R: A language and environment for statistical computing. R Foundation for Statistical Computing:Vienna, Austria. 2010 • Venables, W. N. & Ripley, B. D. Modern Applied Statistics with S. New York:Springer-Verlag,2002 • Wickham, H., ggplot2: Elegant Graphics for Data Analysis. New York:Springer Science+Business Media, Inc., 2009