Download
1 / 20
200 likes | 484 Views
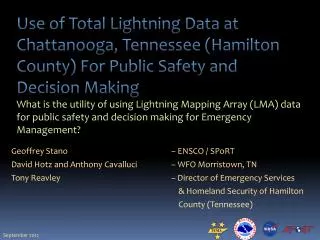
Assessing Lightning Threat using Vaisala VHF Total Lightning Mapping Network Data . Gregory Patrick NOAA/NWS Weather Forecast Office Fort Worth/Dallas TX. Southern Thunder Workshop Cocoa Beach, FL July 28, 2009. Outline. Motivation Background Information

E N D
Assessing Lightning Threat using Vaisala VHF Total Lightning Mapping Network Data Gregory Patrick NOAA/NWS Weather Forecast Office Fort Worth/Dallas TX Southern Thunder Workshop Cocoa Beach, FL July 28, 2009
Outline • Motivation • Background Information • Network and Data Overview • Recent Examples of Flash Extent Density • Conclusions • Ideas for Future Research
Motivation • Informal assessments past several years suggest that lightning activity > 40 km from active convection is common and poses a public safety hazard • Realization that Total Lightning data could be more fully utilized in product issuances that convey CG threat
Background • Value of Total Lightning mapping data has been proven as an aid for severe thunderstorm detection and analysis • Not as many studies on lightning threat posed by CG flashes well-removed from highest radar reflectivity
Network and Data Overview DFW LDAR II network • Range approx 150 km • Data file (netCDF) arrives at WFO Fort Worth every 2 min • Flash Extent Density (FED) is most commonly used product at WFO FWD • FED units are Flashes km-2 min-1 DFW North
LDAR II Data Flow FWD AWIPS D2D Wkstn (ave latency ~ 2 min) Data from Network Sensors Processing andComms – Tucson (netCDF file) SRH FileServer LS1 ServerFWD AWIPS
Examples • 24 Apr 2008 Extensive Lightning in Anvil Region • 06 Nov 2006 Widespread Lightning north of active convective region (trailing stratiform region of MCS)
Composite Reflectivity Imminent CG threat? Cluster of Severe Thunderstorms Moving East
Flash Extent Density 24 Apr 2008 Cluster of Severe Thunderstorms
FED + NLDN Cloud-to-Ground 24 Apr 2008
Examples • 24 Apr 2008 Extensive Lightning in Anvil Region • 06 Nov 2006 Widespread Lightning north of active convective region
0.5 deg Reflectivity Movie 07 UTC – 08 UTC 06 Nov 2006 What is the CG lightning threat across Denton and Collin Counties?
Flash Extent Density Movie 07 UTC – 08 UTC 06 Nov 2006 What is the CG lightning threat across Denton and Collin Counties?
NLDN Cloud-to-ground flashes 07 UTC – 08 UTC 06 Nov 2006 Denton – 8 CGs Collin - 10 CGs
Conclusions • Real-time Total Lightning data has significant value in addition to its use in severe weather operations • Mapping in-cloud flash data in real time helps forecasters visualize threat areas outside convective core regions • A combination of NLDN, total lightning, and radar reflectivity is needed to properly assess CG lightning threat in many situations
Ideas for Future Research Why do some long-distance anvil and stratiform region cloud lightning flashes produce isolated CG lightning flashes and others do not? FED + NLDN at 2352 UTC 17 April 2008 95 km
Ideas for Future Research FED - 17 April 2008 at 2348z Why are isolated cloud lightning flashes initiating in forward anvil regions and how often do they occur? Detached cloud flash in anvil region Supercell
Questions? gregory.patrick@noaa.gov
Network and Data Overview DFW LDAR II network • Lightning discharge process emits VHF radiation pulses • VHF pulses (~ 62 MHz) and Time of Arrival technique used to reconstruct individual cloud and CG flashes in 3D • Range approx 150 km • Data file (netCDF) arrives at WFO Fort Worth every 2 min • Flash Extent Density (FED) is concise integration of data DFW North
Flash Extent Density is the number of lightning flashes that pass through a specific grid box area during a specific time interval (2 min) Computed after all lightning sources are grouped together into flashes FED units are Flashes km-2 min-1 Flash Extent Density