Detection of Copy Number Variations in DMD and APC Genes Using Peak Height Ratio Analysis
This study examines the detection of copy number variations (CNVs) in specific exons of the DMD and APC genes. Supplementary figures illustrate the peak height ratio calculations following melting curve analysis after the 30th PCR cycle. Exon 9 of the DMD gene shows varied results: yellow columns denote duplications, blue indicates hemizygotes, red represents a male hemizygote with duplication, and green shows wild types. Similarly, results for exon 49 of DMD and exons 9 and 14 of APC demonstrate how sample categorizations reveal significant deletions and amplifications across different gene mutations.

Detection of Copy Number Variations in DMD and APC Genes Using Peak Height Ratio Analysis
E N D
Presentation Transcript
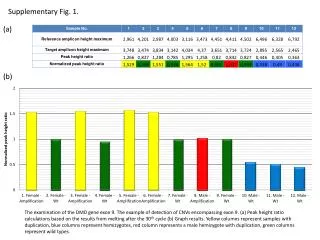
Supplementary Fig. 1. (a) (b) The examination of the DMD gene exon 9. The example of detection of CNVs encompassing exon 9. (a) Peak height ratio calculations based on the results from melting after the 30th cycle (b) Graph results. Yellow columns represent samples with duplication, blue columns represent hemizygotes, red column represents a male hemizygote with duplication, green columns represent wild types.
Supplementary Fig. 2. (a) (b) The examination of the DMD gene exon 49. The example of detection of CNVs encompassing exon 49. (a) Peak height ratio calculations based on the results from melting after the 30th cycle (b) Graph results. Blue columns represent samples with deletion of 1 allele, red columns represent hemizygotes with deletion (resulting in a lack of amplification of the target amplicon), green columns represent wild types.
Supplementary Fig. 3. (a) (b) The examination of the APC gene exon 9. The example of detection of CNVs encompassing exon 9. (a) Peak height ratio calculations based on the results from melting after the 30th cycle (b) Graph results. Blue columns represent samples with deletion of 1 allele, green columns represent wild types.
Supplementary Fig. 4. (a) (b) The examination of the APC gene exon 14. The example of detection of CNVs encompassing exon 14. (a) Peak height ratio calculations based on the results from melting after the 30th cycle (b) Graph results. Blue columns represent samples with deletion of 1 allele, green columns represent wild types.