Download
1 / 27
270 likes | 391 Views
Understanding water consumption patterns is crucial for managing water distribution systems effectively. Learn about different types of water demand, how to determine demands, and allocate them in a model. Explore baseline demands, data sources, and allocation methods.

E N D
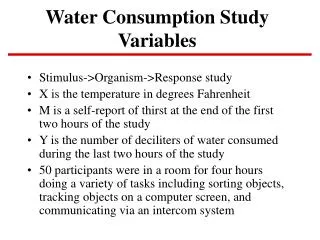
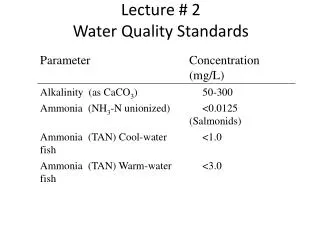
Water Consumption • The consumption or use of water, also known as water demand, is the driving force behind the hydraulic dynamics occurring in water distribution systems. • Anywhere that water can leave the system represents a point of consumption, including a customer's tap, a leaky main, or an open fire hydrant. • The three basic demand types are: 1. Customer demand is the water required to meet the non-emergency needs of users in the system. 2. Unaccounted-for water (UFW) is the portion of total consumption that is "lost" due to system leakage, theft, un-metered services, or other causes. 3. Fire flow demand is a computed system capacity requirement for ensuring adequate protection is provided during fire emergencies. 2
Water Consumption • Determining demands is not a straightforward process like collecting data on the physical characteristics of a system. Some data, such as billing and production records, can be collected directly from the utility but are usually not in a form that can be directly entered into the model. Once this information has been collected, establishing consumption rates is a process requiring study of past and present usage trends and, in some cases, the projection of future ones. • After consumption rates are determined, the water use is spatially distributed as demands, or loads, assigned to model nodes. This process is referred to as loading the model. Loading is usually a multi-step process that may vary depending on the problem being considered. The following steps outline a typical example of the process the modeler might follow: • Allocate average-day demands to nodes. • Develop peaking factors for steady-state runs. • Estimate fire and other special demands. • Project demands under future conditions for planning and design. 3
Baseline Demands Most modelers start by determining baseline demands to which a variety of peaking factors and demand multipliers can be applied, or to which new land developments and customers can be added. Baseline demands typically include both customer demands and unaccounted-for water. Usually, the average day demand in the current year is the baseline from which other demand distributions are built. 4
Data Sources • Pre-Existing Compiled Data • The first step in finding demand information for a specific utility should always include researching for the utility's existing data. Previous studies, and possibly even existing models, may have a wealth of background information that can save many hours of investigation. • However, many utilities do not have existing studies or models, or may have only limited resources to collect this type of information. Likewise, models that do exist may be outdated and may not reflect recent expansion and growth. 5
Data Sources 2. System Operational Records • Various types of operational records are available that can offer insight into the demand characteristics of a given system. Treatment facility logs may provide data regarding long-term usage trends such as seasonal pattern changes or general growth indications. Pumping logs and tank level charts contain data on daily system usage, as well as the changing pattern of demand and storage levels over time. • Water distribution systems may measure and record water usage in a variety of forms, including: • Flow information, such as the rate of production of a treatment or wellfacility. • Volumetric information, such as the quantity of water consumed by a customer. • Hydraulic grade information, such as the water level within a tank. 6
Data Sources 3. Customer Meters and Billing Records • If meters are employed throughout a system, they can be the best source of data for determining customer demands. Customers are typically billed based on a volumetric measure of usage, with meter readings taken on a monthly or quarterly cycle. Using these periodically recorded usage volumes, customers' average usage rates can be computed. Billing records, therefore, provide enough information to determine a customer's baseline demand, but not enough to determine fluctuations in demand on a finer time scale such as that required for extended-period simulations. 7
Cont. Data Sources The most common method of allocating baseline demands Is a simple unit loading method. This method involves counting the number of customers [dunums of a given land use, number of fixture units, or number of equivalent dwelling units] that contribute to the demand at a certain node, and then multiplying that number by the unit demand [for instance, number of gallons (liters) per capita per day] for the applicable load classification. For example, if a junction node represents a population of 200, and the average usage is 120 l/day/person, the total baseline demand for the node would be 24,000 l/day. 8
Example - Demand Allocation In a detailed demand allocation, a key step is determining the customers assigned to each node. The figure below demonstrates the allocation of customer demands to modeled junction nodes. The dashed lines represent the boundaries between junction associations. For example, the junction labeled J-1 should have demands that represent nine homes and two commercial establishments. Likewise, J-4 represents the school, six homes, and one commercial building. 9
Factors affect water consumption • Water cost • Country volume • Commercial and industrial system • Pressure in the network • Sewage system • Weather conditions and Climate • Tradition & habits
Water Consumption • Water consumption is initially split into domestic and non-domestic. The non-domestic consumption relates to the water used for industry and other commercial and public uses (shops, offices, schools, hospitals, etc). • Water demand is commonly expressed in cubic meters per hour (m³/h) or per second (m³/s), liters per second (l/s), or liters per capita per day (l / c /d or lpcpd).
Domestic Consumption • Domestic water consumption is intended for toilet flushing, bathing, showering, laundry, dishwashing and other less water intensive or less frequent purposes as cooking, drinking, gardening, car washing, etc. • In Gaza Strip, domestic water consumption varies from 80 l /c /d for some area to 120 l / c /d .
Domestic demand According to the PWA, The target water demand to be achieved in 2025 is 150 l / c /d. The planned domestic water consumption by PWA is summarized in the following table.
Residential consumption water • The world average water consumption is 280 L/C/day • For Middle East area, the average water consumption is 120 L/C/dayto 180 L/C/day
Non-domestic Consumption • Non-domestic or commercial water use occurs in industry, institutions and offices, tourism, etc. Each of these categories has its specific water requirements. - Industry • Water in industry can be used for various purposes: as a part of the final product, or for the maintenance of manufacturing processes (cleaning, flushing, cooling, etc). • The industrial consumption is largely dependable on the type of product and the technology used. • The industrial consumption is commonly expressed in liters per unit of product or raw material. The following table gives an indication for a number of industries.
Commercial demand • Commercial consumption in restaurants, shops, schools and other institutions can be assessed as a total supply divided by the number of consumers (employees, pupils, patients, etc.). Accurate figures should be available from local records. • Commercial unit consumption are given in the following table :
Unaccounted for Water (UFW) • It’s an unavoidable component of water demand that is supplied ‘ free of charge ’. • Causes of UFW differ from case to case. Most often it is a leakage that appears due to improper maintenance of the network such as defective pipe joints, cracked and broken pipes, faulty valves and fittings. Other losses are related to the water that is supplied but not registered or paid for (under-reading of water meters, illegal connections, washing streets, flushing pipes, etc.)
How to measure UFW? • If meters are employed throughout a system, they can be the best source of data for determining customers consumption. Customers are typically billed based on a volumetric measure of usage, with meter readings taken on a monthly or quarterly cycle. Using these billing records the UFW water quantity can be easily calculated. • The UFW in the developing areas varies from 30 % to more than 50 % of the total water consumption. • According to PWA studies, the UFW is estimated as 30 % of the total water consumption up to year 2010, 25 % up to 2015 and 20 % up to 2020 and then will remain at the same percent.
Total consumption Total consumption is: A+B+C+D+E+F
Example نظام لتزويد المياه يخدم منطقة سكنية عدد أفرادها 1000 شخص بالإضافة إلى مصنع، على مدار السنة كان مقدار الاستهلاك الكلي لمياه الشرب 114,000 م3. قراءات العدادات بالنسبة للمصنع حددت استهلاك للمياه مقداره 38,000 م3. احسب متوسط الاستهلاك السكاني للفرد الواحد ثم حدد الاستهلاك اليومي المتوسط لكل نقطة استهلاك.
In water network design for fire, the following criteria could be used: • The pressure at the fire hydrants (نقاط تغذية) is 20 m head with Q=60m3/hr • The time is two hour • Fire hydrant diameter is 10 cm • The water quantity for fire must be storage to fulfill the emergent need • The distance between the fire hydrant not more than 300 m in cities with middle density • The distance between the fire hydrant not more than 200 m in cities with high density • Fire numbers in the same time can be calculated by: P is population number in thousands