Download
1 / 10
100 likes | 125 Views
Learn how to transform graphs by translating, reflecting, stretching, and rotating them. Understand how equations are related to the original graph. Identify patterns, tables, and effects of vertical and horizontal translations and reflections across axes. Practice combining transformations to modify functions effectively.

E N D
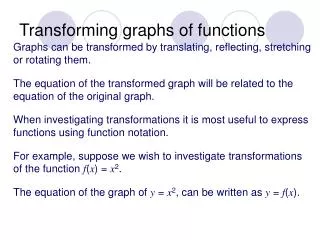
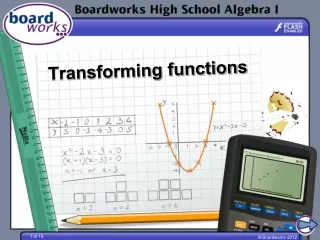
Transforming graphs of functions Graphs can be transformed by translating, reflecting, stretching or rotating them. The equation of the transformed graph is related to the equation of the original graph. y = f(x) When investigating transformations it is useful to distinguish between functions and graphs. For example, to investigate transformations of the function f(x) = x2, the equation of the graph of y = x2 can be written as y = f(x). y = 3 – f(x + 2)
Vertical translations x Here is the graph of y = x2, where y = f(x). y This is the graph of y = f(x) + 1 and this is the graph of y = f(x) + 4. What do you notice? This is the graph of y = f(x) – 3 and this is the graph of y = f(x) – 7. What do you notice? The graph of y = f(x) + a is the graph of y = f(x) translated vertically by a units. Write a table of values comparing these functions.
Horizontal translations x Here is the graph of y = x2 – 3, where y = f(x). y This is the graph of y = f(x – 1), and this is the graph of y = f(x – 4). What do you notice? This is the graph of y = f(x + 2), and this is the graph of y = f(x + 3). What do you notice? The graph of y = f(x + a) is the graph of y = f(x) translated horizontally by –a units. Write a table of values comparing these functions.
Reflections across the x-axis x Here is the graph of y = x2 –2x – 2, where y = f(x). y This is the graph of y = –f(x). What do you notice? The graph of y = –f(x) is the graph of y = f(x) reflected across the x-axis. Here is the table of values: x 1 2 3 4 5 f(x) –3 –2 1 6 13 2 –6 –13 –f(x) 3 –1
Reflections across the y-axis x Here is the graph of y = x2 –2x – 2, where y = f(x). y This is the graph of y = f(–x). What do you notice? The graph of y = f(–x) is the graph of y = f(x) reflected across the y-axis. Here is the table of values: x –2 –1 0 1 2 f(x) 6 1 –2 –3 –2 –3 1 6 –f(x) –2 –2
Vertical stretch and compression The graph of y = af(x) is the graph of y = f(x) stretched parallel to the y-axis by scale factor a. Here is the graph of y = x2 –2x + 3, where y = f(x). This is the graph of y = 2f(x). y What do you notice? This graph is produced by doubling the y-coordinate of every point on the original graph y = f(x). This has the effect of stretchingthe graph in the vertical direction. x What happens when a < 1?
Horizontal stretch and compression x Here is the graph of y = x2 + 3x – 4, where y = f(x). y This is the graph of y = f(2x). What do you notice? This graph is produced by halving the x-coordinate of every point on the original graph y = f(x). This has the effect of compressing the graph in the horizontal direction. The graph of y = f(ax) is the graph of y = f(x) compressed parallel to the x-axis by scale factor . 1 a What happens when a < 1?
Combining transformations We can now look at what happens when we combine any of these transformations. For example, since all quadratic curves have the same basic shape, any quadratic curve can be obtained by performing a series of transformations on the curve y = x2. Write down the series of transformations that must be applied to the graph of y = x2 to give the graph y = 2x2 + 4x – 1. Complete the square to distinguish the transformations: 2x2 + 4x – 1 = 2(x2 + 2x) – 1 = 2((x + 1)2 – 1) – 1 = 2(x + 1)2 – 3
Combining transformations solution These are the transformations that must be applied to y = x2 to give the graph y = 2x2 + 4x – 1: y = x2 1. Translate –1 units horizontally. y = (x + 1)2 2. Stretch by a scale factor of 2 vertically. y = 2(x + 1)2 3. Translate –3 units vertically. y = 2(x + 1)2 – 3 These transformations must be performed in the correct order.