Download
1 / 26
260 likes | 283 Views
Value Stream Mapping October 2016. Agenda. Introduction & Expectations Who are we? Who are you? Spotting Waste within the value chain- activity Value Stream Mapping– The theory Overview of Value Stream: “Why VSM” ? Map process : “AS IS” Highlight weaknesses & improvement opportunities

E N D
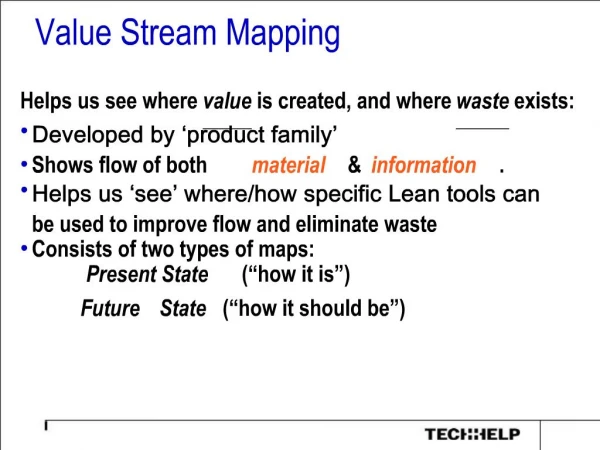
Value Stream Mapping October 2016
Agenda • Introduction & Expectations • Who are we? Who are you? • Spotting Waste within the value chain- activity • Value Stream Mapping– The theory • Overview of Value Stream: “Why VSM” ? • Map process : “AS IS” • Highlight weaknesses & improvement opportunities • Examples of Value Stream Optimization • Example 1 • Example 2 • Value Stream Mapping simulation • Game
Who are we? Sofia Albohaithi Lean Manager Northern Europe Kostas Kefalakis Global Lean Manager
Outcomes/ Expectations Key expectations
Ball game - 5 General rules Kick-off round Create a process to pass over the ball within your team (team of min. 5) You can‘t pass the ball to the person next to you Everybody in your team must have had contact to the ball The ball must return to the person who started with it The ball must travel through the air
Waste can be divided into 7 (+1) types Transport/information transfer Over information/production Motion Inventory Unused potential Defects Over processing/unsuitable methods Waiting
An image instead of words… what’s going wrong? Functional Segmentation (Task bundling/ specialization/ spatial seperation/ department thinking) Push Connections (Lack of demand-orientation and lack of coordination) Big lots (Binder tradition) Media breaks and paper-based infos Serial Processing (In large lots with many interfaces)
Uses and goals of value stream mapping (VSM) Added value of using value stream mapping • Holistic view • Process mapping from a bird’s eye view • Common process understanding • Redesign the value stream • Uncover weaknesses / potential • Alignment with LEAN principles • Restructuring the value chain • Increasing competitiveness • Reducing throughput time (TPT) • Increasing performance level
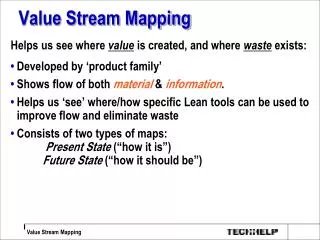
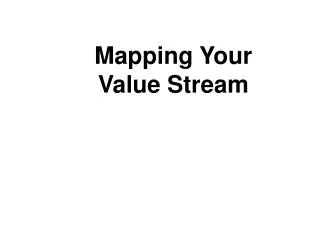
What is value and the value stream? • Value • This is the usage the customer is willing to pay for • Value creation is increasing the value from raw materials up to the end product • Value stream • Contains all activities that are necessary to bring one or more products from raw materials into the form desired by the customer Mechanical manufacturing Pre- assembly Final assembly Supplier Customer Value creation steps
Chain of effects of value stream mapping Process optimization with the support of the tool value stream mapping From analysis to optimization: Concentration of value generation Waste Value Reduction of throughput time (TPT) Higher quality Improved flexibility Smaller stocks Better service Lower costs Reduced complexity Customer Company
Agenda • Introduction • Who are we? • Spotting Waste within the value chain- activity • Value Stream Mapping– The theory • Overview of Value Stream: “Why VSM” ? • Map process : “AS IS” • Highlight weaknesses & improvement opportunities • Examples of Value Stream Optimization • Example 1 • Example 2 • Value Stream Mapping simulation • Game tbc
Systematic optimization of a value stream Process structure on the way to the target value stream AS-IS value stream analysis Value stream VISION AS-IS value stream mapping detached Green field approach (free of restrictions) Zero line in project Uncovering weaknesses Value stream TO-BE 1 (Implementation step 1 of x) Quick wins first! Taking restrictions into consideration
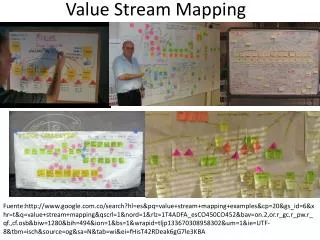
VSM workshop – Brown-paper approach Document flow AS-IS- Value Stream Map
Agenda • Introduction • Who are we? • Spotting Waste within the value chain- activity • Value Stream Mapping– The theory • Overview of Value Stream: “Why VSM” ? • Map process : “AS IS” • Highlight weaknesses & improvement opportunities • Examples of Value Stream Optimization • Example 1 • Example 2 • Value Stream Mapping simulation • Game tbc
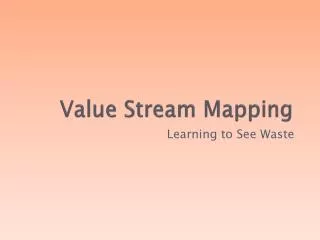
Product Development • A product requires development loops Development Prototyping Assembly Test • The average development loop time is 6 weeks • Teams can go through 30 loops in one project • Identified key value creation points • Identified 26 issues/wastes • Created 10 solutions & implemented 8 • Eliminated ‘throwing over the wall’ communication, rework & firefighting Project overview Key Improvements Potential Impact BEFORE • ~30% time saving per dev. loop • Created a communication platform with clear roles & responsibilities confirming development loop target, timeline responsibilities, outcomes & learnings • Created smoother flow of development loops by creating a concurrent schedule 6 Weeks AFTER 4 Weeks
Agenda • Introduction • Who are we? • Spotting Waste within the value chain- activity • Value Stream Mapping– The theory • Overview of Value Stream: “Why VSM” ? • Map process : “AS IS” • Highlight weaknesses & improvement opportunities • Examples of Value Stream Optimization • Example 1 • Example 2 • Value Stream Mapping simulation • Current VS future state VSM
Value Stream Mapping Game October 2016
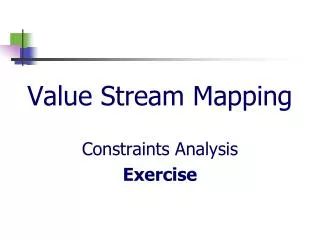
Game structure Architects Design Engineers Check Builders Build Max Time: 45 Minutes
Game Structure – Steps • Step 1: Orientation Together you need to build a tower • Step 2: Setup Split group into 3 teams, put separator pinboards in between each team – handout instruction sheets to each team (next page) • Step 3: Play Observe & time how long each process takes. Game ends • Step 4: Video (map) Show video on how to map the process • Step 5: Map Together the team maps the entire process • Step 6: Video (waste) Show video on identifying wastes in processes • Step 7: Waste Individually each person writes red post-its of wastes observed • Step 8: Vision state Together discuss how to create vision state • Step 9: Run game again (optional) Play game again in new state
Architects – Instructions • Responsibilities • Receiving customer requirements • Designing the Marshmallow Tower • Communicating your design specifications to the Engineering group • Customer Requirements: • Customer wants the tallest possible spaghetti tower with a Marshmallow on top • Measurement starts from the ground up to the Marshmallow • 0-30cm: Poor customer satisfaction • 30-40cm: Average customer satisfaction • 50-60cm: Good customer satisfaction • 60+cm: Great customer satisfaction • Material Budget: • 20 pieces of spaghetti • 1 meter/yard of string • 1 meter/yard of tape • 1 marshmallow • Communication rules: • You are allowed to communicate only via paper
Engineers – Instructions • Responsibilities • Receiving design specifications from Architects • Checking design against structural requirements (example below) • Creating instructions on how to build the marshmallow tower (for the builders) • Communicating instructions to the builders • Structural Requirements: • Minimum 2 spaghetti sticks are required per column (vertical spaghetti not horizontal spaghetti) • Minimum 3 cm wide tape required to connect any two parts • Structure is not allowed to have support structure apart from the ground (no taping to table legs or walls) • Eg: • Communication rules: • You are allowed to communicate only via paper • You can only start your communication with architects after they start communicating with you 1cm tape 3cm tape
Builders – Instructions • Responsibilities • Testing structural capability (Test budget: of 1 marshmallow 10 spaghetti sticks, 50cm tape, 50cm string) • Receiving building instructions from Engineers • Checking building design & instructions against building requirements (below) • Building the Marshmallow Tower as per instructions • Building Requirements: • When using 2 pieces of spaghetti together – You need to use tape to connect them in the middle (see diagram) • You can build the tower only as per Engineering instructions • You need to get approval from Engineering if you want to modify the design or instructions • Communication rules: • You are allowed to communicate only via paper • You can only start your communication with engineers after they start communicating with you tape spaghetti
Questions to ask ourselves What can we remove? What control steps can we limit? What can we do concurrently? How do handovers take place? Are there any air gaps? Is there information starvation? Is there a skill bottleneck? Are we repeating processes?
Video? Pre-read