MAPPING YOUR VALUE STREAM
MAPPING YOUR VALUE STREAM. Maps. Show how work is currently being done Help to make work visible Increased visibility Improves communication Improves understanding Provides common frame of reference to all those who involved with the work process Shows the pathways for improvement.


MAPPING YOUR VALUE STREAM
E N D
Presentation Transcript
Maps • Show how work is currently being done • Help to make work visible • Increased visibility • Improves communication • Improves understanding • Provides common frame of reference to all those who involved with the work process • Shows the pathways for improvement Think of constructing a house without a blue print – an architect communicates with the client using a draft/map
Post-it notes • As a map will have to be drawn and redrawn several times • A detail map is drawn with Post-it-notes • Get all team members to write their own activities • Only put one activity on each Post-it note • The note can be coloured for different functions • Get the owner of the note to place it • Add Post-it notes and rearrange
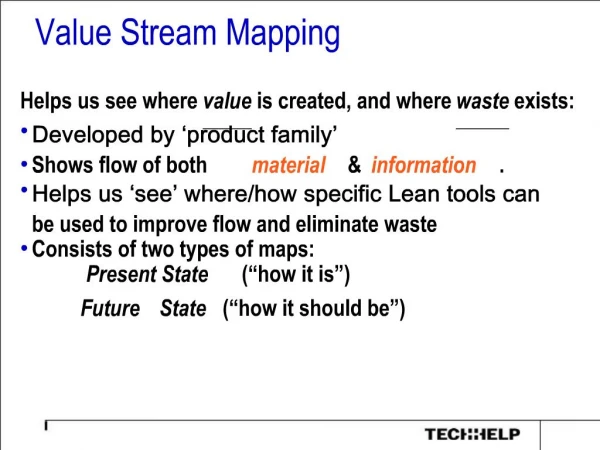
What is a Value Stream A value stream is defined as all the value added and non value added actions required to bring a specific product, service or a combination of products and services , to a customer, including those who in the overall supply chain as well as those in internal operations. Think of a value stream of making a cup of tea
What is Value Stream Mapping • A method to look at the production process to produce your product • Maps/represents production flow and information flow • All levels, • not just individual processes • include your suppliers, and customers too Suppliers Suppliers In-house activities In-house activities Customer /end user Customer /end user Total Value Stream Total Value Stream
Product family • Mapping a value stream is done for one product/ product family, not for every product that moves through the production floor • A product family is a group of products that pass through similar process and through similar machines and equipments • Not possible to have dedicated line for each product • If a single line is used for more products, change over may be high, WIP high, transportation high etc.
Drawing the current state map Draw the current state map by hand. Map the flow of both material and information by walking. Start by identifying the customer requirements and then work the process backwards. IMPORTANT Always start at the customer end of the stream. -What do they see as value?
Customer Requirements • When • Where • How many • How often • Customer forecast • Packing details (size of pack)
Process information to be collected 1. Cycle Time - The length of time which the product spends in a specific part of a process 2. Changeover time - The time taken to change between one product stream/variety to the next 3. Batch sizes - The number of parts in a batch 4. Number of operators - total (+ shift breakdown) 5. Shift time - standard working hours
6. Scrap rate - an indication of the level of quality (e.g. cost of quality, part per million, %success rate, operator gut feeling) 7. Inventory - Number of parts not being worked on 8. Lead-time - The time taken from the receipt of raw material to the delivery to the customer. 9. Make Span - The time between removing the raw material from stores and putting the finished good into stores.
How to Draw the Current State Map Material Flow Mix in Bowl Pour into Mould Cook in Microwave Present Keep it simple as top level not interested in what happens at each of the stages. ie don’t need to know what the ingredients are.
How to Draw the Current State Map Material Flow Mix in Bowl Pour into Mould Cook in Microwave Present Batch Size = 1 Cycle Time = 10 mins No. Operators = 1 per shift Shift = Days/Nights Batch Size = 2 Cycle Time = 60 mins No. Operators = 1 per shift Shift = Days/Nights Batch Size = 1 Cycle Time = 2 mins No. Operators = 1 per shift Shift = Days/Nights Require basic information at each of the stages.
Push vs. Pull Supply Pull - demand driven supply, the upstream process pulls the part from the supplier only when required. The supplier makes the next part only when the previous one has been taken. Push - The supplier makes the part to a given schedule whether the customer requires it or not. The customer takes the part when they are ready for it (if it is ready to take!)
How to Draw the Current State Map Material Flow PUSH PUSH PULL 0 15 mins 20 mins Mix in Bowl Pour into Mould Cook in Microwave Present Batch Size = 1 Cycle Time = 10 mins No. Operators = 1 per shift Shift = Days/Nights Batch Size = 2 Cycle Time = 60 mins No. Operators = 1 per shift Shift = Days/Nights Batch Size = 1 Cycle Time = 2 mins No. Operators = 1 per shift Shift = Days/Nights Look at what’s happening in between the stages of the process. Are things waiting are they being pushed or pulled.
How to Draw the Current State Map Material Flow SUPPLIERS Cargils Keels Arpico 180 mins Mix in Bowl Who supplies the ingredients at each stage. List of ingredients.
How to Draw the Current State Map Information Flow Monthly Visit 30 day forecast Daily Phone Daily order Same for material flow, just find the main constituent parts of the process. Find out how that information is passed on Electronically or manually.
Monthly Visit 30 day forecast Daily Phone Daily order Cargils Keels Arpico How to Draw the Current State Map Daily/ Monthly Daily Input Daily PUSH PUSH PULL 2 0 1 2 180 mins 0 15 mins 20 mins Mix in Bowl Pour into Mould Cook in Microwave Present Batch Size = 1 Cycle Time = 10 mins No. Operators = 1 per shift Shift = Days/Nights Batch Size = 1 Cycle Time = 2 mins No. Operators = 1 per shift Shift = Days/Nights Batch Size = 2 Cycle Time = 60 mins No. Operators = 1 per shift Shift = Days/Nights Leadtime = 287 mins 180 mins 0 mins 15 mins 20 mins 10 mins 2 mins 60 mins VA =72 mins
Why value stream mapping is an essential tool • It helps to visualise more than just a single process (e.g. cutting , packing etc.)- you can see flow • It helps to see more than waste, it helps to identify the sources of waste • It brings discussion points • It forms the basis of the implementation plan - The blue print for achieving door-to-door flow • It shows the linkage between the information and material flow • Value stream mapping is good for describing what you actually going to do
Information Flow • In value stream mapping information flow is as important as the material flow • In lean we should flow information so that one process may make only what is need by the next process and when it is needed
What Makes a Value Stream Lean All we are trying to do is to make only what the next process needs, when it needs it. We are trying to link all processes in a smooth flow, that generates the shortest lead time, with minimum waste. Definition of Lean Manufacturing – The researches of the International Motor Vehicle Programme (IMVP) of Massachusetts Institute of Technology (MIT) defines Lean Manufacturing as “A philosophy that when implemented reduces the time from customer order to delivery by eliminating sources of waste in the production floor”.
Guide lines to draw future state map • Produce to your takt time • Develop continuous flow wherever possible (+line balancing) • Use supermarkets to control production where continuous flow does not extend upstream • Try to send the customer schedule to only one production process (pacemaker process) • Distribute the mix of products evenly over time at the pacemaker process (Level the production mix) • Release and take away only a small, consistent increment of work at the pacemaker process.
1. Produce to your Takt time Your available work time per shift Customer demand rate per shift takt time= • Take time indicates how often you should produce one part or product based on rate of sales • Takt time is used to synchronize the pace of production with the pace of sales. • it gives you the idea the rate at which you should be producing • Producing to Takt time needs • - fast response to problems • - eliminate cause of unplanned downtime • -Eliminate or make the changeover time near zero
2. Develop a continuous flow • This refers to producing one piece at a time • Immediately passed from one process step to next without stagnation • Continuous flow is the most efficient way to produce • In the future state map the continuous flow will replace few process boxes in the current state map • FIFO lane is a good way to start with
3. Use supermarkets where continuous flow does not extend upstream • There are often instances where continuous flow is not possible • Some process are designed to operate at very high rate or low rate and need to change over to multiple products • Suppliers or customers are far away • Some process have a very high cycle time • Unreliable to couple directly to other process in a continuous flow • Out sourcing some process steps • Supermarket means inventory and needs extra material handling requirements • Try to avoid
Supermarket pull system Withdrawal Card Production Card Customer Shipping Final Assembly Controlled Inventory = Product For custom products, finished goods are not produced to a supermarket
4. Try to sent the customer schedule to only one process • The pull system typically needs to schedule only one point of the door-to-door value stream • This point is called the pacemaker process • No supermarkets down stream to the pacemaker process • i.e. pacemaker process is the most downstream continuous flow process
5. Level the production mix • Batching in the assembly mean the fabricated components are consumed in batches • This swells the inventory throughout the value stream • Leveling the product mix means distributing the production of different products evenly over the time • Instead of assembling all Type A product in the morning and Type B product in the afternoon, reputedly do both in smaller quantities. • Better you do leveling you will respond to your customer positively
6. Create an initial pull by releasing and withdrawing a small amount of work • Many companies release large batches of work • Then there is no sense of the takt • The amount of work done by operators vary with peaks and valleys • Difficult to monitor ‘are we behind or ahead’ • Respond for changes is difficult • Load leveling can be helped with a ‘load leveling box’ -heijunka
Q1 -What is ACME’s takt time Your available work time per shift Customer demand rate per shift takt time= Customer requirement-18,400 per month Factory works 2 shifts and 20 days a month Available working time per shift=27,000 seconds Customer demand = 460 units per shift takt time= 60 seconds
Q2 –Should Acme produce finished goods to supermarket or directly to shipping Always try to develop continuous flow, if not supermarkets could be used) Continuous flow means producing one piece at a time.. Acme steering brackets are small (easy to store) Have only two varieties Customer demand rises and falls some what unpredictable Decide to produce to a finished goods supermarket
Q3 –Where can Acme introduce continuous flow Cycle time of ‘Stamping‘ is very low and therefore it has to operate as a batch process producing to a supermarket Check the other times with the takt time Every operation should be slightly below the takt time The operations weld (39s), weld 2 (46s), assemble (62s), and assemble (62s) can set in a cellular system, distributing the work among operators so that each operator has work just bellow takt Total time is 187 s and operators are four, therefore they are slightly underutilised, a process improvement may help removing one operator. Use a Kaizen burst to indicate this on the future state
Q4 –Where can Acme use supermarket pull systems -Stamping – comparatively short cycle time ideally a tiny stamping machine dedicated to this line not in immediate future -Finished good supermarket – shipping in batches decide the batch size and introduce a withdrawal kanban for the supermarket withdrawal kanban triggers the movement of parts Production kanban triggers the production of parts -Raw material- deliveries in batches The amount in the supermarket is decided by the change over times machine down times etc. Reduction in changeover times is essential.
Q5 –What single point in the production is scheduled? (pacemaker process) -All process steps downstream the pacemaker should occur in a flow - As there is a supermarket between weld/assembly and the stamping process, -The weld/assembly process can be used as the pacemaker process -This single scheduling point will regulate the entire value stream in acme plant
Q6 –What is production mix at the pacemaker process? The daily deliver = 420*2 ( left and right brackets) Customer wants 600 (30 trays) of left drive brackets and 320 (16 trays) of right drive brackets. This amount is loaded onto a truck at one time. LLLLLLLLLLLLLLLLLLLLLLLLLLLLLLRRRRRRRRRRRRRRRR Producing this large batches are not acceptable in lean although change over time is a concern -needs reduced changeover time for stamping machine -mix the products more frequently reducing WIP and better response for the customer RLLRLLRLLRLLRLL
Q7 –What amount of work is released by the pacemaker process This amount can be considered as one try of products, i.e. 20 pieces This can be converted to time =20* takt = 20 minutes A load levelling box can be designed to accommodate the kanban cards at this frequency Left Right