Emission and Absorption Spectra in 19th Century
160 likes | 185 Views
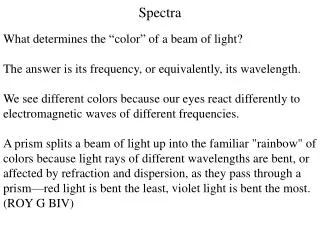
Discover the significance of bright and dark lines in the spectrum, how emission spectra reveal the characteristics of elements, and the concept of absorption spectra in explaining the behavior of hydrogen atoms.

Emission and Absorption Spectra in 19th Century
E N D
Presentation Transcript
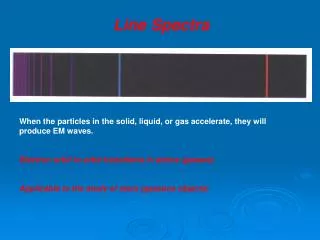
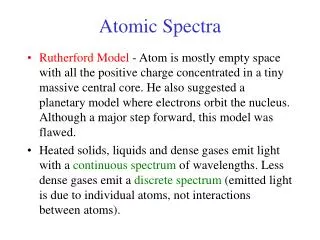
LINE SPECTRA • New methods of splitting white light into its constituent wavelengths in thew 19th century (the diffraction grating) revealed that the spectrum was not completely continuous. • Fraunhoffer discovered dark lines in the spectrum of the Sun
Increasing frequency A single series of lines converges towards the high frequency end of the spectrum
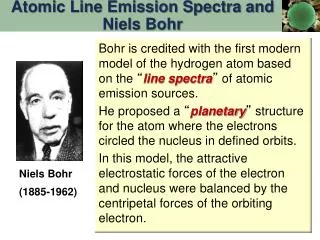
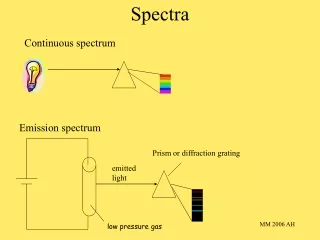
BRIGHT LINES AND DARK LINES • It soon became apparent that these lines were associated with individual elements. • When gases were heated or stimulated electrically they shone with characteristic colours. • When there spectra were taken they were not continuous but consisted of a series of bright lines. • These bright line spectra were called “emmision spectra”
Hydrogen gas at low pressure High Voltage Diffraction grating
Emission spectra always consist of several series of lines becoming closer or “converging” at higher frequency Emission spectrum showing a single series of lines Lines converge towards the blue
Absorption Spectra White light source Diffraction grating screen Cool hydrogen gas When white light is shone throough the cool gas, black lines appear in the continuous spectrum in exactly the same places as the bright lines appeared in the hot gas.
White Light Hydrogen Helium Lithium Mercury Absorption spectrum of hydrogen
Explaining the lines for hydrogen Hydrogen is the simplest atom. It has only one electron. Here the electron is in its lowest energy state: its “ground state” More electron shells that the electron can occupy exist which are higher in energy. The electron cannot occupy a position “in between” these “shells”. An electron which occupies a higher energy state than the ground state will eventually fall back to the ground state When the electron does this it will release a photon of fixed energy
The diagram shows an electron in the second energy level. In falling to the ground state it has to lose photon of fixed energy hf =E1-E2 Where E1 is the energy of the level it falls from and E2 is the energy of the finishing level.
The electron gets to a higher level by absorbing a photon of exactly the right frequency to give it the energy to get there.