Download
1 / 27
270 likes | 421 Views
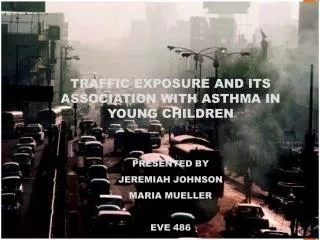
Childhood Asthma and Exposure to Traffic and NO 2. W. James Gauderman , Edward Avol , Fred Lurmann , Nino Kuenzli , Frank Gilliland, John Peters, and Rob McConnell . Epidemiology, Volume 16, Number 6, 2005. Presented by Nina Ewall. Introduction. NAAQS for NO 2 is 53 ppb

E N D
Childhood Asthma and Exposure to Traffic and NO2 W. James Gauderman, Edward Avol, Fred Lurmann, Nino Kuenzli, Frank Gilliland, John Peters, and Rob McConnell Epidemiology, Volume 16, Number 6, 2005 Presented by Nina Ewall
Introduction • NAAQS for NO2 is 53 ppb • Nitrogen oxides are highly reactive gases mainly forming from vehicle emissions, off road equipment, power plants, fossil fuel combustion, and industrial processes • Since 1980, NO2 concentrations have decreased 40% • Average annual NO2 concentrations range between 10-20 ppb http://www.epa.gov/air/nitrogenoxides/
NO2 levels are 30 – 100% higher near roadways (50 m) • Approximately 16% of U.S. housing are located within 300 ft of major roads • Nitrogen oxides (Nox ) includes both Nitrogen oxide (NO) and nitrogen dioxide (NO2) • Nox reacts with moisture, ammonia and other compounds to form small particles • Nox + VO + Sunlight, Heat = Ground Level Ozone (O3) • Short term exposure (30 min – 24 hours) to NO2 results in increased adverse respiratory effects and airway inflammation in various individuals
Paper - Background • Irregular outcomes in studies examining an association between outdoor air pollution and asthma. • Why? • Research utilizes different traffic pollution exposure indicators: air monitoring outside home, centralized ambient air monitor, traffic volumes, residential distance to roads, modeling
European studies have been conducted but variables such as home and street design and relative amounts of diesel to gasoline vehicles may vary
Purpose • To determine whether changes in NO2 concentrations and indicators of exposure to traffic related pollution are associated with the prevalence of asthma (or indicators of asthma)
Participants • University of Southern California Children’s Health Study • 1993 / Cohort 1 and 1996 /Cohort 2 • 4th graders (age - 10 years) • 10 Southern California Communities (2 of 12 communities were excluded because of minor traffic) • Study requirements – subject stayed in same home since enrolling in the cohort studies • Randomly sampled 229 subjects of 890 children for NO2 monitoring
Jerrett M, Shankardass K, Berhane K, Gauderman WJ, Kunzlie N, Avol E, Gilliland F, Lurmann F, Molitor J, Molitor J, Thomas DC, Peters J, and McConnell R, Traffic-Related Air Pollution and Asthma Onset in Children: A Prospective Cohort Study with Individual Exposure Measurement, October 2008, Environmental Health Perspectives, Volume116, Number10 Map of Communities
10 Communities Alpine, Atascadero, Lake Elsinore, Lancaster, Long Beach ,Mira Loma, Riverside, San Dimas Santa Maria and Upland
Nitrogen Dioxide Sampling • Palmes tube diffusion samplers placed outside each home for 2 week periods in summer (mid Aug.) and fall (mid Nov.) 2000 • 208 valid measurements (91%) for both seasons 10% subjects homes received duplicate samplers and travel field blanks • 2 meters above ground (roofline eaves, signposts, rain gutters)
Traffic Pollution Exposure - Measurements • Distance from home to nearest freeway • ( utilized ERSI ArcGIS Version 8.3 / both directions calculated) • Average number of travelling vehicles within 150 meters from homes • (freeways, arterials, major collector roads and minor roads, if possible) • Model estimates of traffic related air pollution at residences, based on dispersion models (Distance to roadways, vehicle counts, vehicle emission rates, and meteorological conditions)
Models – Source • Calculation of vehicle counts near homes (within 150 meters) was derived from daily traffic volumes • California Department of Transportation Highway Performance Monitoring System, 2000 or CALTRANS • Model calculations of traffic related pollution exposure • Based on CALINE4 line source air quality dispersion model • Input variables include roadway geometry, traffic volumes, meteorological conditions (wind speed, wind direction, atmospheric stability, mixing heights) and vehicle emission rates
12 – 68% of NO2 levels are from local mobile source emissions. • Comparisons • Carbonmonoxide (CO) and fine particulate matter (PM) emissions also assessed to determine pollution exposure • NO2, CO and PM were found to be highly correlated (R>.90)
Asthma Questionnaire • “ Has a doctor every diagnosed your child as having asthma?” “yes” • Asthma related questions • Wheezed in past 12 months • Medication to control Asthma • Wheezed during exercised (12 months) • Asthma Risk Factors questions • Parental income, education, tobacco smoking, mildew, water damage, gas stove, pests and pets • Parents were unaware of the focus of the study at the time of completing the survey (self report bias)
Statistical Analysis • A regression models were developed to obtain relationships for each traffic indicator and asthma prevalence • Natural log transformation (positively skewed) • Adjustments made for Hispanic ethnicity, cohort (1993 and 1996), race and sex • Separated models for 2 week (each season) and 4 weeks average • Odds Ratio (OR) were standardized to average interquartile range (IQR) for asthma and traffic indicators
Results • 31 of the 208 study participants (15%) had doctor diagnosed asthma • NO2 concentration range – 12.9 (Atascadero) to 51.5 ppb • (San Dimas) • Considerable variation of NO2 levels occurred from home to home within the communities. Usually variation increased in higher polluted communities ( exceptions were Mira Loma and Alpine)
Results Odds Ratios for 1 IQR (5.7ppb) of exposure (95%CI)
Results • Why were no associations found between asthma and traffic volumes within 150 meters of homes or model based estimates for non freeway pollution ? • Number of vehicles on smaller roads is trivial (10s – 100s) compared to freeways (50,000 – 270,000) • Vehicle counts are less accurately estimated on smaller roads in comparison to freeways • Some Europe studies found association between asthma and traffic counts near residences • Urban geography and homes are closer to heavy traffic
Table 1 Community (n = 208) NO2 (ppb) Community No. Asthma (%) Summer Winter Average† Alpine (AL) 24 21 20.1 19.0 19.6 Atascadero (AT) 13 23 12.3 13.6 12.9 Lake Elsinore (LE) 22 5 17.6 27.4 22.5 Lancaster (LN) 16 19 16.9 22.0 19.5 Long Beach (LB) 20 10 34.6 50.5 42.5 Mira Loma (ML) 17 12 37.2 48.4 42.8 Riverside (RV) 30 20 37.9 42.8 40.3 San Dimas (SD) 34 15 52.0 51.0 51.5 Santa Maria (SM) 19 16 12.7 17.9 15.3 Upland (UP) 13 8 46.3 36.0 41.2 *Parent report of doctor-diagnosed asthma in the child. †Mean in each community of NO2 concentrations measured at homes for 2 weeks each in summer and winter. Average is the 4 week arithmetic average of summer and winter measurements.
Results: Figure 1 60 NO2 (ppb) 4 week average of NO2 measured at homes of asthmatic (black) and non asthmatic children (white)
Association Between 4-Week Average NO2 at Homes and Asthma History Adjusted for Several Potential Confounders Description OR* (95% CI) Base model† 1.83 (1.04–3.21) Base model, with additional adjustment for: Environmental tobacco smoke 1.93 (1.09–3.43) In utero exposure to maternal smoking 1.85 (1.05–3.28) Parental income 1.99 (1.11–3.57) Parental education 1.90 (1.07–3.37) Gas stove 1.87 (1.06–3.30) Mildew 1.81 (1.01–3.23) Water damage 1.82 (1.03–3.21) Cockroaches 1.83 (1.04–3.21) Pets 1.88 (1.06–3.33) *Odds ratio per increase of 1 interquartile range (5.7 ppb) in NO2. †Base model includes adjustments for sex, race, Hispanic ethnicity, cohort, and community.
Table 3 - Associations Between Exposure to Traffic at Home and Asthma History Exposure Metric Odds Ratio per IQR OR* (95% CI) Distance to freeway 1.89 (1.19–3.02) Traffic volume within 150 meters 1.45 (0.73–2.91) Model-based pollution from: Freeways 2.22 (1.36–3.63) Other roads 1.00 (0.75–1.33) Freeways and other roads 1.40 (0.86–2.27) *Odds ratio per change of 1 IQR. For distance to freeway, OR for the 25th percentile compared with the 75th percentile (ie, living closer compared with farther from the freeway). For remaining traffic variables, OR for the 75th percentile compared with the 25th percentile. All models were adjusted for sex, race, Hispanic ethnicity, cohort, and community
TABLE 4. Associations Between Measured NO2 and Asthma-Related Outcomes (n = 208) Distance Model based pollution Measured NO2to Freeway From Freeway Outcome No. OR* (95% CI) OR* (95% CI) OR* (95% CI) Lifetime history of 31 1.83 (1.04–3.22) 1.89 (1.19–3.02) 2.22 (1.36–3.63) Recent wheeze† 43 1.72 (1.07–2.77) 1.59 (1.06–2.36) 1.70 (1.12–2.58) Recent wheeze with exercise† 25 2.01 (1.08–3.72) 2.57 (1.50–4.38) 2.56 (1.50–4.38) Current asthma medication use 26 2.19 (1.20–4.01) 2.04 (1.25–3.31) 1.92 (1.18–3.12) *Odds ratio per change of 1 IQR in exposure (see footnotes to Tables 2 and 4). †Within the last 12 months.
Strengths: • Fairly strong associations were found between several indicators of exposure to traffic related air pollution in residences of S. California and asthma history (prevalence) and symptoms (wheezing) • Measuring NO2 levels or other relevant agents (PM, CO) is an important way to validate the use of traffic measurements as indicators of traffic exposure in a study population • Failure to validate traffic indicators may explain inconsistent results from other studies.
Limitations • This is one study in one region and requires validation in other populations and communities. • It is unclear whether the prevalence of asthma in the study was related specifically to NO2 concentrations (5.7 ppb – low) or a combination of the other various traffic related pollutants associated with NO2 • Concentration of fine particulate matter, black smoke (diesel exhaust)
Limitations • Determination of asthma in questionnaire maybe a reflection of access to healthcare and different diagnostic procedures among doctors • . • Is there a more precise tool? • NO2and traffic measurements were obtained after the onset of asthma and extrapolated to earlier ages • Freeways and major roads have been in the communities for many years