Download
1 / 32
320 likes | 413 Views
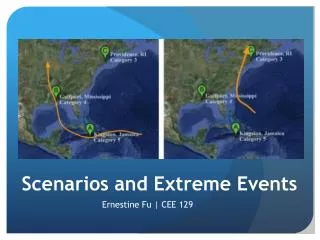
This presentation discusses the Process-Sensitive Upscaling technique for creating flood and drought hydroclimatology scenarios by integrating the paleo-record. The key question is how to transfer global climate change knowledge to individual watersheds to develop useful hydrologic extreme scenarios. The approach of downscaling GCM results is elaborated, with attention to climatic driving forces and causes. Process-Sensitive Upscaling is proposed as a complementary approach, focusing on storm type seasonality and atmospheric circulation patterns with respect to basin size and geographic setting. The plan for building scenarios via this approach includes flood and drought hydroclimatology to determine causes of hydroclimatic extremes. Various theoretical frameworks and advantages of integrating the paleorecord are also discussed.

E N D
Hazards Planning and Policy Panel on the Use of Scenarios to Address Natural Hazards IssuesUCOWR / NIWR Annual Conference July 25, 2007 Some Thoughts On DevelopingClimate-Based Scenariosfor Extreme Hydrologic Events Katie HirschboeckLaboratory of Tree-Ring ResearchThe University of Arizonakatie@ltrr.arizona.edu
OVERVIEW: • Process-Sensitive Upscaling • Flood & Drought Hydroclimatology (causative mechanisms) • Integrating the Paleo-Record
Key Question: How do we transfer the growing body of knowledge about global and regional climate change and variabilityto individual watersheds to develop useful scenarios about hydrologic extremes? KeyNeed: to understand the processes that deliver precipitation (or the lack thereof) to individual watersheds, at relevant time and space scales
ONE APPROACH:DOWNSCALING (Def): Interpolation of GCM results computed at large spatial scale fields to higher resolution, smaller spatial scale fields, and eventually to watershed processes at the surface. from Hirschboeck 2003 “Respecting the Drainage Divide” Water Resources Update #126 UCOWR
RATIONALE FOR PROCESS-SENSITIVE UPSCALING: Attention to climatic driving forces & causes: -- storm type seasonality -- atmospheric circulation patternswith respect to: -- basin size -- watershed boundary / drainage divide -- geographic setting (moisture sources, etc.) . . . can provide a basis for a cross-scale linkage of GLOBAL climate variability with LOCAL hydrologic variations at the individual basin scale . . .
. . . . including EXTREME EVENTS in the “tails” of streamflow probability distributions, such as DROUGHTS & FLOODS.
PLAN FOR BUILDING SCENARIOS VIA PROCESS-SENSITIVE UPSCALING: “FLOOD HYDROCLIMATOLOGY”also“DROUGHT HYDROCLIMATOLOGY” (see Hirschboeck 1988) Scenarios are based ona systematic compilation of watershed-specific information that is used to determine the CAUSES of spatially and temporally varying hydroclimatic extremes:
Flow Time Series Flow Time Series The flood of October 1983(WY 1984) A fairly long record with lots of variability . . . . The long record made the gaging station a candidate for discontinuation in the early 1980s . . . What does this time series of floods look like when each event is classified according to hydroclimatic cause?
Convective events are the most common, but the largest floods in the record were produced by other mechanisms Now that we know the underlying causes for flood magnitudes & frequencies, how do we apply this information to scenario building?
Some hints on scenario-building from the web-based “course” of UA’s Roger Caldwell:“Anticipating the Future” http://cals.arizona.edu/futures/ • Represent Events by Simple Curves • Question Assumptions • Watch for Groupthink and Fixed Mindsets • Expect Both Surprises & ‘Expected Results’ • Several Solutions are Likely
All Peaks Schematic climate-basedcurves torepresent PDFs Tropical storm Winter Synoptic Sumer Convective Santa Cruz River at TucsonPeak flows separated into hydroclimatic subgroups: Hirschboeck et .al. 2000
Question (or Re-Examine) Assumptions: The standard “iid”approach assumes stationarity and independent, identically distributed event probabilities Hirschboeck 1988 Events at each point in time emerge from independently, identically distributed probabilities
Time-varying variances Both Hirschboeck, 1988 Alternative Process-Based Conceptual Framework for Hydrologic Time Series: Time-varying means • Mixed frequency distributions may arise from: • storm types • synoptic patterns • ENSO, PNA, NAM etc., teleconnections • multi-decadal circulation regimes
Alternative Conceptual Frameworks to Explain How Flood Magnitudes Vary over Time: (Arizona watershed scenarios)Based on Different Storm Types . . . Varying mean and standard deviationsdue to different causal mechanisms
. . . Based on Varying Circulation Pattern Changes . . . El Nino year Blocking Regime Zonal Regime La Nina year When the dominance of different types of flood-producing mechanisms or circulation patterns changes over time, the probability distributions of potential flooding at any given time (t) may be altered.
. . . Based onLow-Frequency Variations and/or Regime Shifts: Temporal shifts in dominance of circulation regimes, e.g. PNA, NAM / NAO patterns, etc A low frequency shift in atmosphere or ocean circulation regime (e.g. PDO) OR the anomalous persistence of a given regime . . .. . . will lead to different theoretical frequency / probability distributions over time. Abrupt shift from one PERSISTENT regime to another
ADVANTAGES OF INTEGRATING THE PALEORECORD To build reliable scenarios, the longest record possible is the ideal . . . especially to understand and evaluate the extremes of floods and droughts! By definition extreme events are rare . . . hence gaged streamflow records capture only a recent sample of the full range of extremes that have been experienced by a given watershed.
Paleo -information extracted from . . . TREERINGS & STRATIGRAPHIC PALEO - STAGE INDICATORScan augment the gaged record of extreme events in watersheds in many locations.
1899-1904dry “signature” pattern 1950’s DROUGHT 1905 -19081914 – 1920two wet episodes 1899 &1902 = narrow rings 1952 (one wet year) 1900 & 1904 = missing rings Extreme Years of High & Low Streamflow in the Salt-Verde-Tonto River Basin 1950 &1951 1953 -1956 series of narrow rings A TREE-RING CORE FROM THE SALT RIVER BASIN showing ring-width variations in the 1900s Even in a single tree, the record of extreme wet and dry streamflow episodes is evident.
COMPARISON OF TWO BASINS:Extreme High & Low Flow Years occuring in BOTH Basins Together 1660 1661 1662 1663 1664 1665 1666 1667 1668 1669 1671 1672 1670 = missingring shift to narrower rings Tree-Ring core from the Salt River Basin: wide rings Upper Colorado Basin Salt – Verde Basin
higher-than-normal pressure over both basins lower-than-normal pressure over both basins Atmospheric Circulation Anomalies Driving the Extremes (based on observed record) Widespread Wet Period HIGH FLOWWATER YEARS Widespread Drought: LOW FLOW WATER YEARS LOW PRESSURE HIGHPRESSURE 500 mb Geopotential Height (m) Composite Anomaly, Oct-Sep water year
Using Paleo-stage Indicators & Paleoflood Deposits . . . • -- direct physical evidence of extreme hydrologic events • -- selectively preserve evidenceof only the largest floods . . . • . . . this is precisely the information that is lacking in the short gaged discharge records of the observational period
Compilations of paleoflood records combined with gaged records suggest there is a natural, upper physical limit to the magnitude of floods in a given region --- will this change? Envelope curve for Arizona peak flows
Tropical storm Winter Synoptic All Peaks Sumer Convective Verde River, Arizona Peak flows separated into hydroclimatic subgroups: Verde R. below Tangle Creek From Hirschboeck et .al. 2000
1993 Largest paleoflood(A.D. 1010 +- 95 radiocarbon date) FLOOD HYDROCLIMATOLOGY evaluate likely hydroclimatic causes of pre-historic floods Historical Flood
SUMMARY . . . aPROCESS-BASED “upscaling”approach provides a complementary way to bridge the gaps between local, regional, and global scales of climate information when building scenarios . . . . By associating seasonal and long-term variations in an individual basin’s stream’s hydrograph . . . with the present mix of storm types and the synoptic atmospheric circulation patterns which deliver them . . .
. . . The circulation patterns associated with: -- hydroclimatically grouped flood or drought events / PDFs -- persistent paleodrought episodes -- extreme paleofloods (magnitude or frequency) . . . can then be linked to other features of the global-scale climate that are projected to change such as: -- storm track latitudinal shifts -- circulation/ sea level pressure changes (e.g. Hadley circulation expansion) -- teleconnections & atmosphere-ocean circulation regime shifts. . . . to construct climate-sensitive SCENARIOS
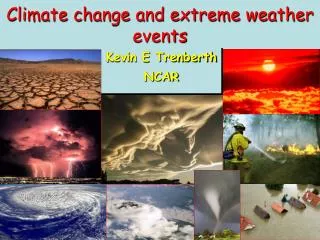
FOR ADDRESSING: HYDROCLIMATICCHANGE Hydrologic impact of earlier snowmelt DROUGHTS Rising temperatures, changing water balances, seasonal shifts, etc. Projected IPCC Modeled Precipitation Change: JJA HYDROLOGIC EXTREMES “Intensification” of the Hydrologic Cycle Projected increases in droughts & floods HAZARDS! Seager et al. 2007 FLOODS
THE FFA“FLOOD PROCESSOR” With expanded feed tube– for entering all kinds of flood dataincluding steel chopping, slicing & grating blades– for removing unique physical characteristics, climatic information, and outliersplus plastic mixing blade– to mix the populations together