Download
1 / 12
120 likes | 328 Views
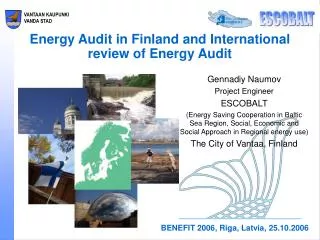
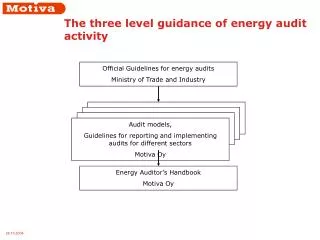
Official Guidelines for energy audits Ministry of Trade and Industry. Audit models, Guidelines for reporting and implementing audits for different sectors Motiva Oy. Energy Auditor’s Handbook Motiva Oy. The three level guidance of energy audit activity. Starting of energy audits.

E N D
Official Guidelines for energy audits Ministry of Trade and Industry Audit models, Guidelines for reporting and implementing audits for different sectors Motiva Oy Energy Auditor’s Handbook Motiva Oy The three level guidance of energy audit activity
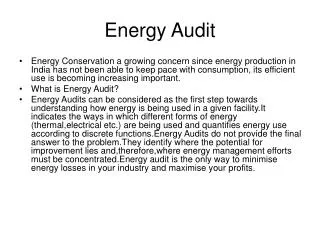
Starting of energy audits • The company’s special needs, targets • The content, meaning and instructions of energy auditing procedure supported by the ministry • Voluntary energy conservation agreements • Links of energy auditing to environmental, quality and other functional systems or procedures of the company • Resources for auditing (own work or outsourcing) • Bidding • Evaluation of the tenders • Decision of energy auditing Filling the forms for subsidies , Decision of the support Start
The same targets in every audit model • Comprehensive study • Heating/electricity/fuels/renewables/water costs and energy consumption • Results: • Break down of consumption • Better understanding about energy costs, energy consumption etc. • Proposals for saving measures • Justification • Economy (savings, investments… • Other effects and impacts
7. Saving measures and economy 6. Process 5. Process services 4. Building 3. Consum ption, costs TABLE 2 2. Basic info Savings € Invest. € Pay back period TABLE 1 Saving measur. 1 1. Summary - text - tables 1,2 - econ.prof. - Sankey diagram - process block diagr. Cons. now Saving pot. Invest. Saving measur. 2 Electr. : : Fuels Total Water Total Savings € 0 1 2 5- 3-4 Energy Analyses in Industry Report Model (MOTIVA) App. Kauppa- ja teollisuusministeriön tukema energiakatselmushanke DNro: 333/954/93 Päätöksen pvm 30.12.1993 J P - T A L O T E K N I I K K A ENERGY ANALYSES REPORT Company Ltd Helsinki 5.9.1999 Company Oy Jaakko Pöyry Group PL 27, 00131 HELSINKI Puh. 09 - 46911 Fax. 09 - 4691 311
Energy audits in industry Energy audit • process service systems • facilities Energy analysis • processes • process sevice systems • facilities Energy audits in process industry will be carried out in two phases Facilities Process service systems Processes
Energy - analyses for process industry Phase 1: Factory audit Audit, phase 1 Survey phase = Factory audit carried out by a team of professionals Report of the factory audit (Preliminary Plan for Energy Saving) Audit report energy breakdown, saving potential • Audit report saving proposals • needs for Complementing Analyses, rough saving potential and profitability, preliminary project plans • Phase 2. Complementing analyses saving meas. . • CA Complementing analyses training • CA ... • • More detailed studyof report report saving potential found in CA factory audit report report report report Strategic Report planning • measures • saving potential of the unit • investments • Strateg . invest. • pay back period Budjeting Scheduling PES Annual Reports to Plans for energy saving (requirements of Agreement of Energy Saving) the Finnish • potential / targets Industrial • shedules and costs organisations
Energy efficiency in process services Example: Load and energy efficiency analyses of compressed air systems 95 120 90 100 85 80 80 Electric load [kW] 60 75 Electric load [kW] 40 70 Week end 65 20 60 0 time 1 11 21 31 41 51 61 71 81 91 101 111 121 131 141 151 161 171 181 191 201 time [s] Electric load change (15 min average) during a week Idling and working load need of compressed air and possibilities to replacements pressure level, condition of the network production costs, efficiency of use energy efficiency of production of compressed air, possibilities to improve the efficiency heat recovery etc.
Total consumptions, energy costs, saving potentials and investments of 20 energy audits in the industry sector with total energy consumption of 70-500 GWh/a during the period 1992-2002
Energy savings potential found in energy audits (in industry in Finland) • Fuels 10-15 % • Electricity 4-8 % (even lower in process industry) • Water 10-15 % • Average pay-back time for investments 2-3 years • About one third of the savings potential can be realised without major investments (operational measures) • Two thirds of the savings potential will be realised during next 3-5 years period after the audit