Download
1 / 21
210 likes | 364 Views
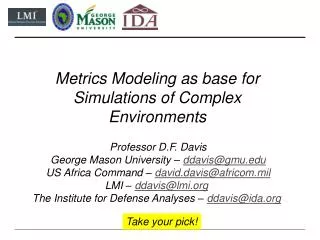
Metrics Modeling as base for Simulations of Complex Environments. Professor D.F. Davis George Mason University – ddavis@gmu.edu US Africa Command – david.davis@africom.mil LMI – ddavis@lmi.org The Institute for Defense Analyses – ddavis@ida.org. Take your pick!.

E N D
Metrics Modeling as base for Simulations of Complex Environments Professor D.F. Davis George Mason University – ddavis@gmu.edu US Africa Command – david.davis@africom.mil LMI – ddavis@lmi.org The Institute for Defense Analyses – ddavis@ida.org Take your pick!
Metrics modeling: Using the metrics framework as the base for analysis. All assessment/metrics/evaluations normally consist of a set of measurements that are aggregated to some overall meaning. This aggregation technique is what I’m referring to as a metrics model.
Most Frequent Top down decomposition aggregated by Multi-Attribute Utilities Most Important Next Important Next Important Next Important And so on….
However If and only if the decompositions are collectively exhaustive and mutually exclusive – cover every thing, doesn’t leave anything out, and are independent in definition. Most common error is that they are nowhere near independent, and are often highly dependent. Of course, knowing that you have included all necessary elements is always risky. But, they are easy to use and all you have to do is determine the weights.
Bumper Sticker Metrics need to be organic to the plan, not appliquéd.
Value Focused Metrics Use decomposition for only the highest level, fundamental or strategic elements (Fundamental Objectives Hierarchy or FOH) – be careful and don’t expect much. Use a Means Ends Objectives Network (MEON) to represent the intermediate, dependent objectives and exploit the relationships. This is difficult because it requires that you graph your understanding of the inherent theory of change. Identify for some or all of the objectives metrics that would indicate the level of achievement of that objective.
Value Focused Metrics - 2 Objectives should be written as something you wish to achieve. If they can be caused to happen directly, they are tasks or activities, not objectives. Therefore tasks are something that you identify and execute with the hope that they will assist in the achievement of the objectives. The MEON represents how you believe the objectives support one another and propagate the results of activities up to the achievement of the fundamental objectives.
The System Outcome Metrics Triggers Fundamental Objective Hierarchy Means Ends Objective Network Process Metrics Controls, Activities, Programs, Projects
The Process • Develop the strategic and fundamental objectives • Create a Means Ends Objectives Network (MEON) • Identify candidate metrics • Identify activities that influence the MEON • Identify triggers for events • Exercise the model to validate and develop understanding
Strategic and Fundamental Objectives
Means Ends Objectives Network (MEON)
The Metrics Perceptions “112 Types” Resources Financed Interministerial Roles and Missions Number of ministries participating National Emergency Management System Key Ministries Participate Subordinate Plans Exist Participates in Developing Scenarios Participates in Agenda Development Creates List of Attendees Shows up with Attendees Presents in plenary
The Rest Uncertain Events Things that can be controled Things that mightbe influenced
Initial State The initial state of the system depends on your prior beliefs in how the objectives relate and how the tasks impact the objectives. It also depends on what your assessment of the relationship between the actual state of the objective and the measures that may be collected. Lots of numbers, lots of data, difficult to ‘understand.’
Issues VFM allows for beliefs and hard data. Missing data valued by prior beliefs Lots of data and elicitation Mathematically defendable Very hard to brief …
Simulation Claim By varying the accomplishment of tasks in a structured, but randomized way, a simulation of the system can be constructed. Haven’t done it yet, but think I know how.