Download
1 / 3
30 likes | 155 Views
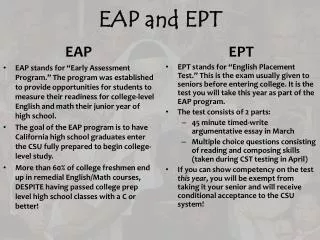
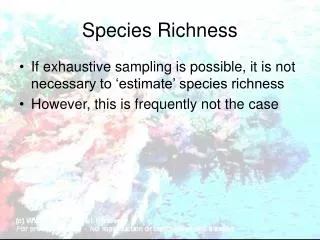
EPT richness is a key indicator of stream health, representing the number of mayfly (Ephemeroptera), stonefly (Plecoptera), and caddisfly (Trichoptera) species present in a watershed. This study reveals that wooded areas often show lower EPT richness scores, particularly in Woods Creek, which has high canopy cover but poor insect communities. The Oregon Department of Environmental Quality's Observed/Expected scores indicate that degraded stream habitats and potential water pollutants may contribute to this decline. Understanding these dynamics is crucial for effective watershed management and conservation.

E N D
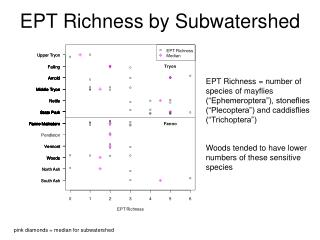
EPT Richness by Subwatershed EPT Richness = number of species of mayflies (“Ephemeroptera”), stoneflies (“Plecoptera”) and caddisflies (“Trichoptera”) Woods tended to have lower numbers of these sensitive species pink diamonds = median for subwatershed
Observed/Expected Scores by Subwatershed Observed/Expected is a score developed by the Oregon Dept. of Environmental Quality that compares the number of species you observed at your site to the number typically observed at healthy “reference” sites. A score of 1 means your site is comparable to a healthy watershed. The lower the score the poorer the stream health
Woods stations that consistently scored poorly Woods had high amounts of canopy and low amounts of impervious surfaces, but poor stream insect communities. Poor stream habitat (fine-grained stream bottom) or pollutants in the water may possibly explain why Woods Creek has poor insect communities in spite of having lots of trees.