Download
1 / 21
230 likes | 371 Views
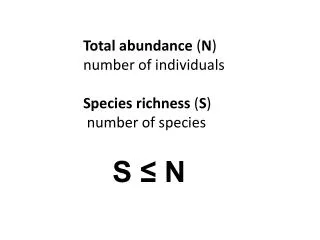
Species Richness. If exhaustive sampling is possible, it is not necessary to ‘estimate’ species richness However, this is frequently not the case. Species Richness Rarefaction.

E N D
Species Richness • If exhaustive sampling is possible, it is not necessary to ‘estimate’ species richness • However, this is frequently not the case
Species RichnessRarefaction • Rarefaction is a statistical method for estimating the number of species expected in a random sample of individuals taken from a collection • It is useful for comparing 2≥ samples when the number of individuals in the sample is not equal • More on this approach later…
Species RichnessJackknife Estimate • When quadrate sampling is used to sample the community, it is possible to use another nonparametric approach, the “jackknife”, to estimate species richness • It is based upon the frequency of unique species (spatially, not numerically) • Abundance data is converted to +/-
Species Richness: Jackknife Estimate • Based upon presence and absence of species and is driven by the number of rare species S = s + (n-1 / n)k where S = Jackknife estimate of SR s = Observed total number of species in n quadrates n = Total number of quadrates sampled k = Number of unique species
Species Richness: Jackknife Estimate Sp A Sp B Sp C Sp D Sp E Sp F Sp G* Sp H* Sp I* Sp J * Sp K Sp L Sp M* Sp N
Jackknife • Five species occur in only one quadrate and are thus defined as unique species S = s + (n-1 / n)k S = 14 + (9/10)5 = 18.5 species Variance estimate var(S) = (n-1/n)[∑(j2fJ)-k2/n] var(S) = (9/10)[(1)2(3) + 22(1)–52/10]=4.05 18.5 ±(2.26)(√4.05 ) = 13.9 to 23.1 (t-distribution)
Species RichnessJackknife Estimate Sp A Sp B Sp C Sp D Sp E Sp F Sp G* Sp H* Sp I* Sp J * Sp K Sp L Sp M* Sp N
Jackknife • Five species occur in only one quadrate and are thus defined as unique species S = s + (n-1 / n)*k S = 14 + (9/10)*5= 18.5 species Variance estimate var(S) = (n-1/n)[∑(j2fJ)-k2/n] var(S) = (9/10)[(1)2(3) + 22(1)–52/10]=4.05 18.5 ±(2.26)(√4.05 ) = 13.9 to 23.1 (t-distribution)
Bootstrap • An alternative approach of estimating species richness from quadrate samples is to use the bootstrap procedure. It is similar to jackknife, but needs a computer to obtain estimates • Essentially it samples with replacement
Bootstrap • To calculate species richness B(S) = S + ∑(1-Pi)n where S = observed number of species pi = proportion of the n bootstrap quadrates that have species i present
Species Richness • Some (Smith and Belle 1984) have suggested using the jackknife estimator when the number of quadrats is small and the bootstrap estimator when the number of quadrats is large (n ≈ 20)
Heterogeneity Measures • Most communities there are relatively few abundant species and lots of rare species • If we know the parent distribution, we can estimate species diversity (not richness)
Nonparametric IndicesSimpson’s Index • Simpson suggested that diversity is inversely related to the probability that two individuals picked at random belong to the same species 1-D = 1-∑ (pi )2 where 1-D = Simpson’s index of diversity pi = Proportion of individuals of species i in the community
Shannon-Wiener Function • Based upon information theory and represents a measure of the order (or disorder) contained in a system (for relatively large communities) • Consider 4 aspects • (1) number of species • (2) number of individuals of each species • (3) the places occupied by individuals each species • (4) the places occupied by individuals as separate individuals
Shannon-Wiener Function H’ = ∑ (pi)(log2 pi) where H’ = information content of sample = index of diversity s = number of species pi = proportion of total sample belonging to ith species
Brillouin Index • Similar to SW (information theoretic), it is used for a finite population sampling without replacement H = (1/N) log(N!/n1!n2!n3!...) where H = Brillouin’s Index N = number of individuals in sample n1 = number of ind belonging to sp 1 n2 = number of ind belonging to sp 2
Evenness • Many evenness indices, but few null models of evenness • Essential problem is that rare species are missed disproportionately in small collections, so evenness will decrease in sample size
Evenness Measures • Many different measures, most common is to scale one of the heterogeneity measure relative to its maximal value when each species in the sample is represented by the same number of individuals Evenness = D/DMAX or D-DMIN/DMAX-DMIN Maximum diversity is DMAX = 1/S
Evenness • Hurlbert’s (1971: Ecology) probability of an interspecific encounter (PIE), which measures the probability that two individuals drawn randomly from the colelction represent different species PIE = (N/N-1)[1-∑(mi / N)2] S i=1
Evenness • Table 2.1 (Gotelli) • Species diversity of carabid beetles in young vs. old pine plantations
Evenness Young Plantation Old Plantation