Download

1 / 43
430 likes | 539 Views
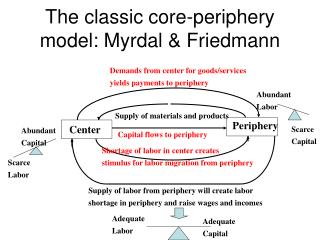
Evidence of Segregation? Using PLASC to model the core catchment areas of schools. Rich Harris rich.harris@bris.ac.uk http://rose.bris.ac.uk KEY WORDS: schools, segregation. Outline. Set the scene Introduce a method for modelling the de facto, effective or ‘core’ catchment areas of schools

E N D
Evidence of Segregation?Using PLASCto model thecore catchment areasof schools Rich Harris rich.harris@bris.ac.uk http://rose.bris.ac.uk KEY WORDS: schools, segregation
Outline • Set the scene • Introduce a method for modelling the de facto, effective or ‘core’ catchment areas of schools • Primaries in London (also Birmingham) • Use those models to look at apparent processes of ethnic separation
Building on existing research • There is segregation between schools • But then there is segregation between neighbourhoods • Schools Vs neighbourhoods (post-residential sorting) • e.g. Johnston et al. (2006) • 'it has been shown herein that not only is there ethnic segregation in the country’s primary and secondary schools, but also in addition – for both the South Asian populations and for the Black Caribbean and Black African populations – that school segregation is very substantially (and significantly) greater than is the case with residential segregation.‘
Observed Vs Expected (?) • Census zones and their entire populations are taken to represent the pupils expected to attend the schools, not just those of school age • Census zones assumed congruous with the schools' areas of recruitment. • Census populations are conflated with school populations. • Develop a better counter-factual when assessing the (observed) ethnic profiles of schools against what they 'should be'.
A more local focus • The geography which matters is the local, not the national or regional, and the scale of analysis should be commensurate with the local markets within which schools (and parents faced with placement decisions) actually operate. (Gibson & Asthana, 2000a: 304). • How do those local markets affect and how are they affected by school choices? • In the context of debates about segregation / polarization.
Another angle • A model of school allocations • Lijk ƒ (i, j, k, l) • i: pupil, j: school, k: census ‘neighbourhood’, l: neighbourhood group • Parents tend to send their child to the nearest school to their home; • but only where there is a 'sufficient presence' of their child's ethnic group. • That ‘sufficiency’ can vary by ethnic group and 'neighbourhood type‘ • Geographically naïve: Lijk ƒ Si
The Geography of Supply • To estimate where and by how much schools compete with each other within spaces of admission; • and to consider whether the ethnic compositions of those spaces ('the neighbourhoods') are representative of the actual compositions of schools. • This is achieved by determining the ‘core catchment’ areas of schools – here, primary schools within Birmingham, England.
Mapping School Catchment Areas • Schools neither have de jure catchment areas • nor unlimited capacity • so parental choice is constrained, ultimately by admissions criteria. • Pupils tend to attend local primary schools • and so there is a clustered geography of attendance. • That geography is revealed by mapping the home address of each pupil attending any given school (from PLASC micro-data) • The task is to define that pattern.
Some Criteria • We don’t want the modelled catchment areas to be over-dispersed. • Some pupils live far from their schools • But we also don’t want them to be over-fitted to one specific set of pupils. • If a postcode is near to a school and contains a pupil attending that school then it likely belongs in the (potential) catchment area. • But so too does a neighbouring postcode even if it does not contain a pupil attending that school – potentially the school could have recruited from there too. • Compact and unbroken • ‘optimised‘ to areas where attendance at any particular school is prevalent
About the data • PLASC • Pupil Level Annual Census Returns • Data on all pupils in primary and secondary schools in England • 2006 data • Information on state educated primary school students (5-11 years old) • And on secondary school pupils • 'Self-identified' ethnic category collected from parents when students enrol • Also records postcode unit of pupils' homes • Which they school they attend • School type (selective? Faith school?) • Measure of deprivation (take a free school meal)?
Defining ‘core catchments’ • Imagine centring a rectangle at (mid-x, mid-y) based on the residential postcodes of pupils attending a school.
Imagine centring a rectangle at (mid-x, mid-y) based on the residential postcodes of pupils attending a school. • Let the rectangle grow outwards
Imagine centring a rectangle at (mid-x, mid-y) based on the residential postcodes of pupils attending a school. • Let the rectangle grow outwards • Until it encloses a certain proportion of all pupils who attend the school…
Imagine centring a rectangle at (mid-x, mid-y) based on the residential postcodes of pupils attending a school. • Let the rectangle grow outwards • Until it encloses a certain proportion of all pupils who attend the school… • Here p = 0.40
Imagine centring a rectangle at (mid-x, mid-y) based on the residential postcodes of pupils attending a school. • Let the rectangle grow outwards • Until it encloses a certain proportion of all pupils who attend the school… • Here p = 0.50
Some Refinements • Two datasets used simultaneously: one has the postcode grid references rotated by 45º • Search is now N, NE, E, SE, S, SW, W, NW, N
The direction of growth is determined as that which returns highest n1 / n2 • where n1 is number of pupils in area going to the school • n2 is all pupils in the area (go to any school)
Catchment is then defined as the convex hull for pupils of school within the search area.
Catchment is then defined as the convex hull for pupils of school within the search area. • Continues until a certain proportion of all pupils who attend the school are enclosed…
Imagine centring a rectangle at (mid-x, mid-y) based on the residential postcodes of pupils attending a school. • Let the rectangle grow outwards • Until it encloses a certain proportion of all pupils who attend the school… • Here p = 0.50
Other methods? • Why not just find the ‘n’ nearest neighbours to a school • Because that does not consider prevalence • The ‘at risk’ population • And it assumes the school is at ‘the centre’ of its catchment • Why not use some sort of ‘hot spot’ analysis • Could do but it would likely over-calibrate on a specific set of pupils rather than revealing the schools’ potential catchment areas
Processes of Segregation (?) (1) • Friction of distance / ‘least cost’ perspective • identify any pupils that appear to be travelling further to school than they need to • pupils that live within the core catchment of at least one primary school but attend another school of which they are not in the core catchment. • May not be a matter of choice • some schools will be over-subscribed • catchments are defined to contain only 50% of the pupils at the school. • Is the propensity to attend any one of the ‘near schools’ consistently lower for some ethnic groups?
Defining ‘Near’ • Define as being near to a pupil any primary school that has a core catchment that includes the pupil’s residential postcode • Here the pupil has three near schools
Proportion attending any near school(target catchment p=0.50) LONDON
Proportion attending any near school(target catchment p=0.50) BIRMINGHAM
Proportion attending any near school(target catchment p=0.75) BIRMINGHAM
Proportion attending any near school(target catchment p=0.25) BIRMINGHAM
Processes of Segregation (?) (2) • Evidence of a ‘migratory’ process • But also local processes of segregation? • when two or more schools strongly overlap in terms of their potential spaces of recruitment but attract different ethnic groups • polarization • Disentangle • migratory and local processes of seperation • residential and post-residential sorting
Pairwise Comparisons • Looking inside the catchments • Expected intake VsLocally observed intake • Looking also at the final profile of each school • Expected intake VsFully observed intake • Can also compare the profiles of locally ‘competing schools’ • ones that overlap (strongly) in terms of their core catchment areas
Visual Summary (LONDON) • Shows only those schools with highest expected % Black Caribbean
Visual Summary (LONDON) • Shows only those schools with highest expected % Bangladeshi
Visual Summary (Birmingham) • Shows only those schools with higher than ‘fair share’ % Black Caribbean
Visual Summary (Birmingham) • Shows only those schools with higher than ‘fair share’ % Bangladeshi
Segregation Index • Which schools are least representative of their catchments? • Compared against • J is a school, e is the number of ethnic groups • pEXPECTED is the finally observed profile of a school • pRANDOM is the ethnicity profile obtained for a school if half of its intake is randomly sampled from its core catchment and the other half sampled from outside of it
All ‘Significantly Segregated’ Schools(Birmingham) • Meaning schools where the final ethnic profile of the school is not what’s expected based on the composition of their core catchments.
‘Significantly Segregated’ Schools (London) • 21% of all primary schools in London exhibit significant post-residential sorting • The figure rises to an average of 44% for all ‘faith schools’ but it ranges from 18% to 78% • When debating faith schools need to be careful about treating them as a homogenous group
Summary • Consistent with previous studies • Black Caribbean pupils appear more likely to travel further to school than they need do • Because they are more geographically dispersed? • Clear evidence of post-residential sorting is found • Role of faith schools? • Evidence of polarization where locally competing schools draw markedly different intakes.
What the study does not Show • That ethnic separation is a ‘bad thing’ • That polarization would disappear without a system of school choice. • That recent school reforms have either worsened or improved ethnic separation. • That ethnic groups actively avoid each other. • That it is actually ethnicity that drives the processes of separation.