Download
1 / 37
370 likes | 592 Views
Chesapeake Bay and Potomac River Estuaries: Land-Water Linkages, Pollution Issues and Restoration Efforts. Walt Boynton Chesapeake Biological Laboratory Center for Environmental Science University of Maryland November, 2010. I thought NITROGEN was a good thing?. N x magic = fish.

E N D
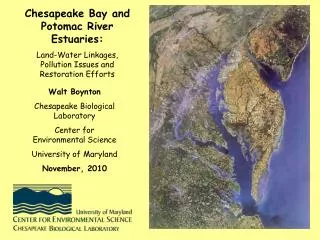
Chesapeake Bay and Potomac River Estuaries: Land-Water Linkages, Pollution Issues and Restoration Efforts Walt Boynton Chesapeake Biological Laboratory Center for Environmental Science University of Maryland November, 2010
I thought NITROGEN was a good thing? N x magic = fish Has the Bay passed a tipping point? Do we need to do anything yet…is it that bad? All this stuff is so complicated Is hypoxia such a bad thing? What to say about Estuaries, Pollution and Solutions… in 35 minutes or less?
So, What’s this talk about? • Land-Water Linkage and how that has changed • Over-fertilization of estuaries (eutrophication…nutrient obesity)…too much N and P! • Restoration examples…it’s not all gloom and doom!
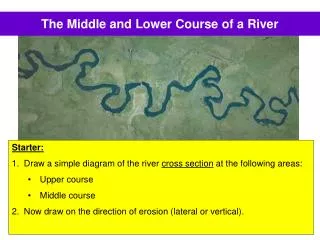
Chesapeake Watershed and Estuary 14 to 1 • It’s hard to see the Bay because of so much drainage area! • There is just 0.17 acres of Bay per person in 2007 • > 30 acres per person prior to 1607 • A 150-fold increase in people density
Ches Bay Examples: N, P decrease Feedback effects Key Bay Features • Bay is closely connected to the land (11,000 miles shoreline; 19 major rivers; 400 creeks) • The Bay is extremely shallow (mean depth = 20 feet) • Most of its surface area is in tributaries & sounds • Slow exchange with ocean (4-6 months)… the water hangs around • All of this leads to a very productive Bay but also to a Bay sensitive to pollution
1973 2002
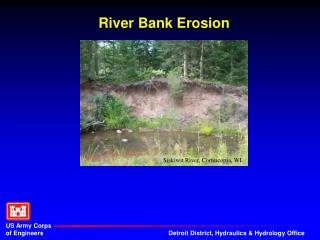
The Bay and a Flood of Sediments and Nutrients • A satellite image, spring 1987 • We have partially changed the Bay watershed "from filter to funnel" • Note the heavy runoff of silt in the lower western shore rivers, coming from rains in Virginia Piedmont region. • Must focus on restoring the watershed's natural water treatment systems
A Useful Definition Eutrophication is an increase in the rate of supply of organic matter to an ecosystem. Fertilization of waters with NITROGEN and PHOSPHORUS promotes excess of organic matter in these systems… ALGAL BLOOMS (Photo: ICPRB)
Historical Increases in Patuxent N-Loading Patuxent River Current Conditions Before Intense Development Before John Smith arrived • 7-Fold Increase since John Smith’s arrival to Bay Area • 50% Increase during first 360 yrs & 50% increase in last 40 yrs
These Nutrients (nitrogen and phosphorus) cause Algal Blooms
Patuxent River EstuaryCirca 1832 • “Of all the bright rivers that flow into it (Chesapeake Bay) there is not one which excels the Clearwater (Patuxent) in the purity of its waters.” • “So transparent are its waters that far out from shore you may see, in the openings of the sea-weed forest, on its bottom the flashing sides of the finny tribe as they glide over the pearly sands.” The Old Plantation by Hungerford (1859)
Chesapeake Seagrasses • 13 species • Freshwater to marine • Decline started 1960’s • 300,000 to 38000 acre • 20% of all tidal bottom areas once covered with SAV
Seagrass Decline in Chesapeake Bay • Sharp decline in upper Bay in early 1960’s • Modest recovery since mid-1980’s • Nutrients and dirt increase water column turbidity and enhance algal growth on SAV leaves… main cause of decline was lack of light • A huge habitat change Adapted from Kemp et al 2005.
Estimated Mesohaline SAV Coverage (note the Log scale) (From Stankelis et al 2003)
Examples of Epiphyte Fouling at CBL (Solomons)
Patuxent River Nitrogen Inputs 1960 - 2007 Decades of rapid development BNR starts Pre-development and 60’s drought Drought period
Seagrass Re-Invasion • Re-Invasion started in shallow waters • SAV trapped suspended sediments • Near-shore water becoming clearer • Possibly a THRESHOLD response to NUTRIENT reduction
Conservation Practices Deliver Water Quality Benefits Cover Crop Program 32
Tidal and other marshes act as super “Nutrient Sponges” …so, retain and build wetlands
Tidal Marshes: Hotspot in the Landscape Tidal Marshes 2% of basin landscape removes 50 % of N inputs to estuary 5400 2700 Inputs from all sources Export to lower estuary N losses in marshes 2700 Units = Kg N/day
Treatment Plants vs Tidal Marshes • Wastewater Treatment Plant N Removal via Denitrification = 0.8 million Kg/year • Tidal Marsh N Removal via N burial and denitrification = 0.9 million Kg/year • Both important…need to promote denitrification in the landscape!
Storm Water Management: Wet Pond Example Pollutant Removal Efficiencies: TSS: 46% TP: 46% TN: 32% There have been THOUSANDS of these constructed in the Patuxent Basin…HOW or IF they work is largely unknown
Concluding Thoughts • Restoration of ecosystems in the face of high growth rates is tough… success with require some serious innovation and efforts • Diffuse and atmospheric nutrient sources will need serious attention and fixes will be expensive • There is a need to focus on landscape-scale “hot spots” for preservation (e.g., tidal marshes) and restoration (in the urbanized basins)….small projects here and there will not fix the problem • Being an Ecologist now is very exciting and challenging…so, think about it!