Download
1 / 41
410 likes | 429 Views
This presentation discusses the key findings from a study on the early labor market experiences of recent graduates from the University of the West of England. Topics include employment utilization of HE skills, difficulties in obtaining appropriate employment, impact of mass higher education, equality of opportunity, and policy expansion justification.

E N D
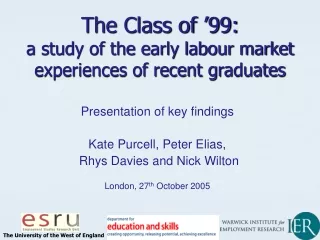
The Class of ’99:a study of the early labour market experiences of recent graduates Presentation of key findings Kate Purcell, Peter Elias, Rhys Davies and Nick Wilton London, 27th October 2005 The University of the West of England
Are graduates obtaining employment which uses their HE skills and knowledge? Which graduates have difficulty in obtaining appropriate employment? How has the move to mass higher education impacted upon the labour market? Has the expansion of higher education led to greater equality of opportunity? Is current policy to expand higher education justified in the light of graduates’ experiences? The issues we sought to address
The research • Postal and web survey of 1:2 of all domestically-domiciled students who gained a first degree or diploma from a sample of 38 UK HEIs (same HEIs which provided information about their 1995 graduates for an earlier study) • Follow-up telephone interviews with selected sub-sample • Data collected between February 2003 and April 2004 – most survey data in May 2003
Parental background of sample (NSSEC) by gender
Type of school attended, by type of institution attended
A level scores (or equivalent) of graduates who completed their degrees under the age of 25, by type of HEI
Reported use and usefulness of career information and guidance sources by graduates
The SOC(HE) classification • Traditional graduate occupations • Modern graduate occupations • New graduate occupations • Niche graduate occupations • Non-graduate occupations • ( For more details, see www.warwick.ac.uk/go/glmf )
The changing structure of graduate occupations in the UK, 1980 - 2000 Source: New Earnings Survey Panel Dataset 1975-2000
Changing structure of occupations, UK, 1984-2014 This study Source: Unpublished estimates and projections of employment: Warwick Institute for Employment Research / Cambridge Econometrics, 2005
Comparison of early career trajectories of ‘95 and ‘99 graduates
The occupational evolution of employment among ‘99 graduates
Movement of ‘95 and ‘99 graduates out of non graduate jobs 1995 graduating cohort 1999 graduating cohort
Exit of ’99 graduates from non-graduate employment by degree subject
SOC(HE) distributions of ‘95 and ‘99 graduates 3.5 and 4 years after graduation
Factors considered relevant by ’99 graduates in obtaining current job
A comparison of the job quality of ‘95 and ‘99 graduates Better Worse
Who is in a non graduate job four years after graduation? Employment in non-graduate occupations varies by: • Subject (Medicine 5%, Arts/Humanities 20%+) • Degree class (1st 10%, 3rd 25%) • HE type (Old 14%, HE College 23%) • Unemployment since graduation (none 15%, 6 months 31%) • Geographical mobility (Move 14%, Stay 19%) • Gender and age • Work experience while studying
Are the earnings of graduates declining? • Graduate earnings premium in the UK is higher than in many other countries – is it holding up or is it falling? • Limited evidence so far indicates that there may have been a decline in the premium – but how can we tell when we only study graduates? • Compare earnings of 1995 graduates in 1998/99 with 1999 graduates in 2003/04: • adjust for earnings inflation; • adjust for longer time spent in labour market by 1999 graduates.
Between December 1998 and May 2003, UK index of average earning grew by 25% After adjusting for the greater length of time spent in the labour market by the 1999 cohort, estimate that the earnings of the 1999 cohort are lagging behind those of the 1995 cohort by about 10% Other recent research shows similar picture (O’Leary and Sloane 2005; McGuiness and Doyle 2005). Nevertheless, the return to a degree remains substantial.
What factors are associated with variation in earnings and the gender pay gap? • We conducted a detailed multivariate analysis of the variations in earnings of graduates in full-time employment in 2002/03 (excluding those aged 38 and over). • We tested for variations associated with social class, entry qualifications, class of degree, post graduate qualifications, type of institution, age, gender, a range of job characteristics and family situation
What factors are strongly related to variations in earnings graduates working full-time? • Working hours (+1% per additional hour) • Degree required by employer (18% addition) • Sector (ICT, banking, business services: +4% to +12% more than other sectors) • Age (3% more per additional year of age) • Disability (7% less) • Type of job held (-12% to -17% for nongraduate job)
What factors are strongly related to variations in earnings? (contd.) • Class of degree (15% less for a third class) • Subject studied (Arts -6%, maths & computing +7%, medicine and related +20%: relative to social sciences) • Lives in London and SE (+23% for Inner London, +17% for Outer London) • Contractual status (-13% if self employed) • Gender context at work (-13% if works exclusively with women) • Gender (5% less if female)
Response to statement ‘In my workplace, my type of job is done …’
Average earnings by gender context at work and gender of respondents
Why do graduate women in their early careers earn less than similarly-qualified males? • Less investment in human capital by women? • Different kinds of skills – valued less? • Discontinuous employment? Part-time working? • Different values and attitudes to career development and work/life balance? • Underachievement? Different ambitions or expectations? • Rational choice now to future work/life paths? • Discrimination by employers?
Age profiles of hourly earnings by gender and qualifications, 1999 - 2003 Source: Labour Force Surveys, 1999 - 2003.
Moving from ‘accounting for’ to ‘explaining’ the gender pay gap • Implications of cumulative gendered ‘choices’ • Are differences employment-related or reflecting wider differences in values and aspirations • Work/life balance and ‘the sex/gender dilemma’ • Practical obstacles to equality of opportunity in employment • Gender stereotypes at work as constraints • Discrimination, harassment and the challenge of being ‘a woman in a man’s world’
The financial legacy • 81% of young graduates had repayable debt, mean £6,205, median £5,500. • Term time employment more prevalent among lower social class groups. • Term time employment associated with poorer degree performance. • Those who indicated that their options had been limited by debt were: • less likely to undertake further study; • more likely to be employed in non- graduate jobs.
1999 graduates’ satisfaction with career 4 years on, by gender
Extent to which respondents would, with hindsight, do degree again, by gender
Summary • Proportion of graduates in the labour force will continue to rise steadily, at least until 2020. • The demand for graduate skills and knowledge is projected to grow. • Shortages of high level technical skills are likely to continue (esp. medicine). • Graduates are likely to displace non graduates in competition for ‘new’ graduate jobs. • Gendered boundaries in graduate employment becoming less distinct – work/life balance policies will become increasingly important. • The extension of HE participation has, so far, disproportionately benefited those from relatively privileged backgrounds – which presents a major challenge for the policy community.
To find out more about this and the team’s other research on the graduate labour market, check out the following links: • www.dfes.gov.uk/research/...? • www.delni.gov.uk/statistics/ • www.warwick.ac.uk/ier • www.uwe.ac.uk/bbs/research/esru/ • www.hecsu.ac.uk The University of the West of England