Download
1 / 19
200 likes | 477 Views
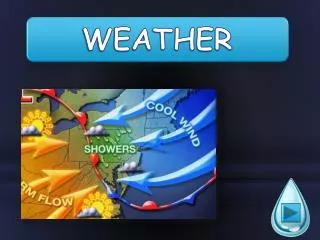
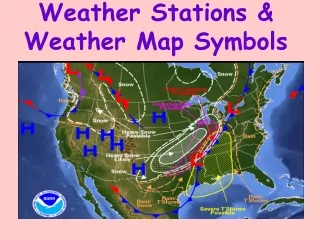
Learn how to read weather symbols on a map to understand temperature, precipitation, dew point, cloud cover, air pressure, wind direction, and fronts. Interpret isobars, recognize high and low pressure systems, and differentiate weather conditions through visual symbols.

E N D
Temperature • Top left number shows the temperature
Weather Symbol • The symbol between the two numbers on the left indicate what the weather is in terms of precipitation.
Notice how more symbols indicate intensity • More snow flake symbols =more snow • More rain symbols = heavy rain
Dew Point • The number on the bottom left shows the Dew Point. • Humidity is a factor of the dew point. • This number will be lower than the actual temperature. • Remember cold air can’t hold moisture like warm air
Cloud Cover The percentageof the circle that is shaded in reflects the percentage of cloud cover in the sky Similar to a pie chart
Air Pressure • This number is displayed on the top right of the weather symbol • When the # is high or rising, the weather is fair because the pressure is high • When the # is low or dropping, the weather is rainy, because the pressure is low
Wind Barb • This shows the direction of the wind, it will point in the direction the wind is coming from, this shows the wind coming from the Southeast • The # of lines and/or triangles indicates the speed of the wind
The wind barb points in the direction it is coming FROM. • Stronger winds have more flags, or marks
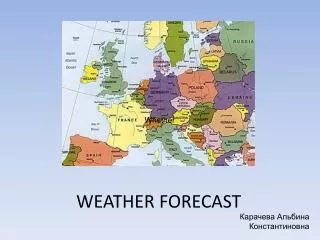
Fronts on a weather map • Warm occluded • Cold • Stationary • The symbols point in the direction that the front is moving towards Pressure symbols:
Isobars: connect areas with equal air pressureThe distance between the isobars is called the pressure gradient • The closer the isobar lines, the greater the change in air pressure, and the greater/faster the winds speeds. • High pressure systems bring clear/sunny weather and wind flows out and clockwise (right) • Low pressure systems bring overcast/stormy weather and wind flows in and counter-clockwise (left)