Download
1 / 30
310 likes | 433 Views
This resource delves into the significant relationships represented in graphs, highlighting the connection between variables such as practice time and skill level, temperature fluctuations throughout the year, and a person’s weight change traveling from Earth to space. It covers essential graph components including the Y-axis (dependent variable) and X-axis (independent variable), as well as direct and indirect relationships. Learn to set up and interpret graphs showing how study time affects test grades, and observe dynamic equilibria like ocean levels amidst evaporation.

E N D
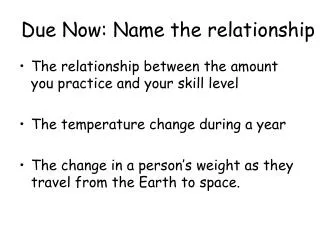
Due Now: Name the relationship • The relationship between the amount you practice and your skill level • The temperature change during a year • The change in a person’s weight as they travel from the Earth to space.
Seasons Topic: Graphing the Changing Environment Time Day/Night
Parts of a Graph • -
Y Axis – Dependent Variable - Origin X Axis – Independent Variable -
Relationship between hours worked and pay Independent Variable – Working Hours Dependent Variable – Pay Setting up a graph
Graphing – Hours worked & Paycheck When hours worked is high, pay is high 28 21 Pay (dollars) Direct Relationship 14 7 When hours worked is low pay is low 1 2 3 4 Time Worked (hours)
Inverse or Indirect Relationship - - Y Axis Density Temperature X Axis
Cyclic (Cycle) Relationship - High Tides Low Time (hours)
Constant – No change-Static - Mass Travel from the Earth to the Moon
Non-Sense Graph DO NOT PICK – NOT POSSIBLE
Rate of Change - Rate of Change = Change in Field Value Change in Time
Graphing – Hours worked & Paycheck What is the rate of change between these two points? 28 21 Pay (dollars) 14 7 1 2 3 4 Time Worked (hours)
Example (28 – 7) Dollars (4-1) Hours 21 Dollars 3 Hours 7 Dollars/Hours
Example D Number of Cell Phone Users What is the rate of change from point A to point B C B A Years (1986 = 1)
Example (A-B) (3000–1000) Users (4-2) Years 2000 Users 2 Years 1000 Users/Year
Example D Number of Cell Phone Users What is the rate of change from point B to point C C B A Years (1986 = 1)
Example (B-C) (14,000–3,000) Users (7-4) Years 11,000 Users 3 Years 3,667 Users/Year
Example (C-D) • What is the rate of change between Points C and D?
Extrapolation - Y Axis Density Temperature X Axis
Interpolation - Y Axis Density Temperature X Axis
Equilibrium • - • - Dynamic
Example – Oceans are constantly evaporating, why is the ocean level remaining constant?
Name that Relationship Y Axis - X Axis
Name that Relationship Y Axis - X Axis
Name the relationship • The relationship between the amount you practice and your skill level • The temperature change during a year • The change in a person’s weight as they travel from the Earth to space. - - -
FQ Draw a graph showing the relationship between time studying and grade on a test