
Uploaded by
stephen-daugherty
5 SLIDES
135 VIEWS
50LIKES
Event Correction and Shift Analysis for Ladder Sensors in Data Processing
DESCRIPTION
Introducing a shift in sensor data analysis for improved accuracy. Compare dV vs sensor plots pre and post-correction for Sector 4 and 7.
Download
1 / 5
Download Presentation 
Event Correction and Shift Analysis for Ladder Sensors in Data Processing
An Image/Link below is provided (as is) to download presentation
Download Policy: Content on the Website is provided to you AS IS for your information and personal use and may not be sold / licensed / shared on other websites without getting consent from its author.
Content is provided to you AS IS for your information and personal use only.
Download presentation by click this link.
While downloading, if for some reason you are not able to download a presentation, the publisher may have deleted the file from their server.
During download, if you can't get a presentation, the file might be deleted by the publisher.
E N D
Presentation Transcript
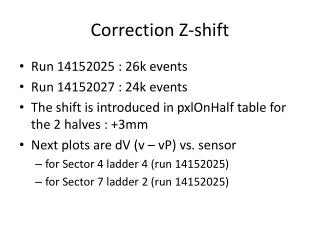
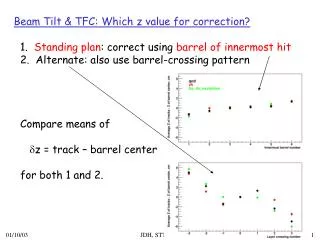
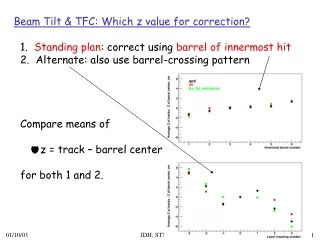
Correction Z-shift • Run 14152025 : 26k events • Run 14152027 : 24k events • The shift is introduced in pxlOnHalf table for the 2 halves : +3mm • Next plots are dV (v – vP) vs. sensor • for Sector 4 ladder 4 (run 14152025) • for Sector 7 ladder 2 (run 14152025)


More Related