Download
1 / 42
420 likes | 552 Views
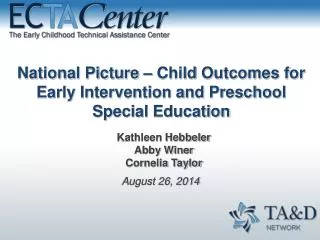
National Picture – Child Outcomes for Early Intervention and Preschool Special Education. Kathleen Hebbeler Abby Winer Cornelia Taylor. August 26, 2014. On Today’s Call. Brief review of the national data Data quality Completeness of data State-to-state variation Change over time.

E N D
National Picture – Child Outcomes for Early Intervention and Preschool Special Education Kathleen Hebbeler Abby Winer Cornelia Taylor August 26, 2014
On Today’s Call • Brief review of the national data • Data quality • Completeness of data • State-to-state variation • Change over time
Method for Calculating National Estimates • Weighted average of states that met minimum quality criteria • Minimum Quality Criteria: • Reporting data on enough children • Part C – 28% or more of exiters • Part B Preschool – 12% or more of child count • Within expected patterns in the data • category ‘a’ not greater than 10% • category ‘e’ not greater than 65%
Number of States that Met Criteria for Inclusion in the National Analysis
Part C: Reason States Were Excluded from Analyses (out of 51)
Part B Preschool: Reason States Were Excluded from Analyses (out of 51)
What We See • Continuing to see consistency over time • Increasing number of states who meet minimum quality criteria for national analysis • Increasing number of children in the child outcomes data
Current Emphasis of State Requests • Data Quality • Increasing the number of children/families in the data • Pattern checking to identify data quality issues • Training, guidance, supervision, etc. • Using Data for Program Improvement • SSIP data analysis • Identifying trends in the data • Identifying areas of low and high performance • Identifying meaningful differences
Part C: Percent of States by Completeness of Child Outcomes Data* * Completeness = (total with outcomes data/total exiters) 14
Part B Preschool: Percent of States by Completeness of Child Outcomes Data* * Completeness = (total with outcomes data/child count) 15
Part C: Positive Social Emotional Skills Progress Category ‘b’ – All States National: 21%
Part C: State Variation: Greater than Expected Growth – Social Emotional, 2012-2013, All States National: 66%
Part B Preschool: Knowledge and Skills Progress Category ‘b’ – All States National: 15%
Part B Preschool: State Variation: Exited within Age Expectations – Knowledge and Skills, 2012-2013, All States National: 53%
Part C: Exited within Age Expectations by State Percent of ExitersNot Eligible for Part B* 2012-13 - All States
Part C: Average Percentage Who Exited within Age Expectations by State Percent Served*, 2012-13 – All States *http://therightidea.tadnet.org/assets/2514
Part C: Average Percentage Who Exited within Age Expectations by ITCA Eligibility Category, 2012-13, All States 23
Part B Preschool: Average Percentage Who Exited within Age Expectations by State Percent Served, 2012-13, All States
Part C: Longitudinal Patterns All StatesOutcome 1 Summary Statement 1
Part C: Longitudinal Patterns All States, Last 3 Years, Outcome 1 Summary Statement 1 28
Part C: Longitudinal Patterns States Included in National Estimate, Last 3 Years Outcome 1 Summary Statement 1 (30 states) 29
Part B 619: Longitudinal Patterns All StatesOutcome 1 Summary Statement 1 30
Part B 619: Longitudinal Patterns All States,Last 3 Years, Outcome 1 Summary Statement 1 31
Part B 619: Longitudinal Patterns States Included in National Estimate, Last 3 Years Outcome 1 Summary Statement 1 (25 states) 32
Part C: Statistically Significant* Change between 2011-12 and 2012-13 : 41 States That Met the Criteria *p<.01
Part B Preschool: Statistically Significant* Change between 2011-12 and 2012-13: 39 States** That Met the Criteria *p<.01 ** Two states excluded because there was insufficient data from 2011-12 to make the comparison
Conclusions • The data continue to be used by the federal government to justify funding. • Results Driven Accountability is shining a spotlight on each state’s child outcomes data. • States can expect more scrutiny around data quality. • The criteria used for the national analyses do not set a high bar for data quality.
How We Can Help! • State data quality profiles for FFY 2012-13 were sent out • Email Abby Winer with questions: abby.winer@sri.com • Contact us for help with data quality analysis and quality assurance activities • Contact us for help with program improvement planning and data analysis
Updated National Graphing Template • http://www.ectacenter.org/eco/pages/summary.asp#summarygraph
Data Quality: Pattern Checking http://www.ectacenter.org/eco/assets/pdfs/Pattern_Checking_Table.pdf Training materials on looking at data: http://www.ectacenter.org/eco/assets/ppt/LookingAtData_revised.ppt 40
Other Resources • Additional data quality resources • http://www.ectacenter.org/eco/pages/quality_assurance.asp • Data analysis for program improvement http://www.ectacenter.org/eco/pages/usingdata.asp • SSIP-related Resources • http://www.ectacenter.org/~calls/2014/ssip/ssip.asp
Reminders & Announcements • We hope to see you at the Improving Data, Improving Outcomes Conference! • The Outcomes for Children and Family Outcomes flyers will be available at the conference • Stay tuned for an upcoming presentation of Family Data: Indicator C4Highlights
Find More Resources At: http://www.ectacenter.org/eco