Download
1 / 30
300 likes | 456 Views
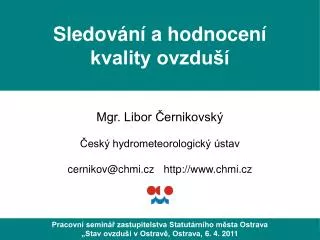
Sledování a hodnocení kvality ovzduší. Mgr. Libor Černikovský Český hydrometeorologický ústav cernikov@chmi.cz http://www.chmi.cz. Pracovní seminář zastupitelstva Statutárního města Ostrava „Stav ovzduší v Ostravě, Ostrava , 6. 4. 2011. Obsah. ČHMÚ Sledování kvality ovzduší

E N D
Sledování a hodnoceníkvality ovzduší Mgr. Libor Černikovský Český hydrometeorologický ústav cernikov@chmi.cz http://www.chmi.cz Pracovní seminář zastupitelstva Statutárního města Ostrava„Stav ovzduší v Ostravě, Ostrava, 6. 4. 2011
Obsah • ČHMÚ • Sledování kvality ovzduší • Hodnocení kvality ovzduší • ČR vs. Evropa • Ostravsko-Karvinsko • Znečištění ovzduší během zimních období • Imisní limity: EU, USA vs. WHO guidelines
Český hydrometeorologický ústav • ČHMÚ je ústředním státním ústavem České republiky pro obory čistota ovzduší, hydrologie, jakost vody, klimatologie, meteorologie, poskytující objektivní odborné služby přednostně pro státní správu; dle pověření MŽP provozujev oblasti znečištění ovzduší: • Státní imisní síť na území ČRČHMÚ je národní referenční laboratořízodpovědnou za QA/QC v oblasti imisív České republice • Informační systém kvality ovzduší ČR • Emisní databázi • autorizace a akreditace systémuimisního monitoringu • informování, posudky, modelování,publikace, projekty…
Aktuální informace o znečištění ovzduší Centrální databáze ČR Automatická monitorovací stanice Regionální sběrné centrum Mezinárodní výměna WWW imisní monitoring Informace pro úřady apod. Informační linka 596 900 265 Teletext ČT str. 178 – 181 • http://www.chmi.cz
Hodnocení kvality ovzduší • Lokality měření imisí • Překročení imisních limitův průběžném a minulém roce • Tabelární přehledy měsíční, čtvrtletní a roční • Tabelární a grafické ročenky • Oblasti se zhoršenou kvalitou ovzduší (OZKO) • Informace o emisích http://www.chmi.cz
ČR vs. Evropa Evropské agentura pro životní prostředí(European Environment Agency EEA), např.: • http://www.eea.europa.eu/themes/air/airbase • http://air-climate.eionet.europa.eu/databases/airbase • http://www.eea.europa.eu/maps/ozone/map • http://eyeonearth.cloudapp.net EEA rovněž vydává souhrnné hodnotící zprávy - viz http://www.eea.europa.eu/publications
PM10 2005, 36. nejvyšší denní koncentrace Zdroj: EEA
Ostravsko-Karvinsko Moravskoslezský kraj, resp. jeho průmyslová a nejhustěji obydlená část Ostravsko-Karvinska, je jednou z nejvíce znečištěných oblastí nejen České republiky, ale spolu se sousední polskou Hornoslezskou pánví i v rámci Evropy. Imisní limity pro ochranu zdraví a cílové imisní limity trvale a významně překračují v této oblasti koncentrace suspendovaných částic frakce PM10i PM2,5, benzo(a)pyrenu a benzenu, ojediněle i oxidu dusičitého.
Oblasti se zhoršenou kvalitou ovzduší 2002–9vzhledem k imisním limitům pro ochranu zdraví bez zahrnutí ozonu PM10,SO2, NO2, C6H6,Pb
Oblasti se zhoršenou kvalitou ovzduší 2006–9vzhledem k cílovým imisním limitům pro ochranu zdraví bez zahrnutí ozonu benzo(a)pyren As, Cd, Ni,O3
Průměrné 24hodinové koncentrace PM10 Četnost průměrných 24h koncentrací, Ostravsko-Karvinsko, X/1999–II/2009 průměrný počet dnů za rok
Bylo znečištění ovzduší během zimní sezóny X/2010–III/2011 vyšší nebo nižší než během zimní sezóny X/2009–III/2010 ?
Průměrné roční koncentrace PM10 2011: předběžné údaje !!
Průměrné koncentrace PM10v chladných polovinách roků (X.–III.) Období 2010–2011: předběžné údaje !!
Průměrné 24hodinové koncentrace PM10v chladných polovinách roků Období 2010–2011: předběžné údaje !! X /X: hodnota vyšší / nižší než předchozí sezónu
Signály regulačních řádů Vyhláška č. 373/2010 Sb. koncentrace PM10 1 hod naměřené 12 hod klouzavé průměrné 24hod klouzavé průměrné
Imisní limity pro ochranu zdravíDirective 2008/50/EC on ambient air quality and cleaner air for Europe, NV 597/2006 Sb. PM2.5: 25 µg.m-3 cílový limitod 2010 a imisní limit od 2015 + průměrný ukazatel expozice 2. fáze: 20 µg.m-3od 2020… … v roce 2013 Komise přezkoumá s ohledem na nové poznatky o dopadech na zdraví a životní prostředí, technickou proveditelnost a zkušenosti členských států s cílovou hodnotou
WHO Air Quality Guidelines 1987+ • The guidelines are intended to provide background informationand guidance to (inter)national and local authorities in making riskassessment and risk management decisions. In establishing pollutant levelsbelow which exposure - for life or for a given period of time -does notconstitute a significant public health risk, the guidelines provide a basis forsetting standards or limit values for air pollutants. • Although the guidelines are considered to be protective to human healththey are by no means a “green light” for pollution, and it should be stressedthat attempts should be made to keep air pollution levels as low as practicallyachievable. • In general, the guidelines address single pollutants, whereas in real lifeexposure to mixtures of chemicals occurs, with additive, synergistic orantagonistic effects. • It is a policy issue to decide which specific groups at risk should be protected by the standards and what degree of risk is considered to be acceptable. These decisions are influenced by differences in risk perception among the general population and the various stakeholders in the process, but also by differences in social situations in different countries, and by the way the risks associated with air pollution are compared with risks from other environmental exposures or human activities.National standards may therefore differ from country to country and may be above or below the respective WHO guideline value.
WHO Air Quality Guidelines 2000& Global Update 2005 SO2µg.m-3 24 hod: 125* vs. 20 1 hod: 350 vs. -- 10 min: -- vs. 500 * 2000 guideline level NO2 µg.m-3 rok: 40 vs. 40 1 hod: 200 vs. 200 O38 hod: 120 vs. 100 µg.m-3 Rok - ng.m-3 Cd rok: 5 vs. 5 C6H6 rok: 5 vs. no safe level Ni rok: 20 vs. no safe level As rok: 6 vs. no safe level BaP rok: 1 vs. --
USA - National Ambient Air Quality StandardsUS EPA, http://www.epa.gov/air/criteria.html (1) Not to be exceeded more than once per year. (2) Final rule signed October 15, 2008. (3) The official level of the annual NO2 standard is 0.053 ppm, equal to 53 ppb, which is shown here for the purpose of clearer comparison to the 1-hour standard (4) To attain this standard, the 3-year average of the 98th percentile of the daily maximum 1-hour average at each monitor within an area must not exceed 100 ppb (effective January 22, 2010). (5) Not to be exceeded more than once per year on average over 3 years. (6) To attain this standard, the 3-year average of the weighted annual mean PM2.5 concentrations from single or multiple community-oriented monitors must not exceed 15.0 µg/m3. (7) To attain this standard, the 3-year average of the 98th percentile of 24-hour concentrations at each population-oriented monitor within an area must not exceed 35 µg/m3 (effective December 17, 2006). (8) To attain this standard, the 3-year average of the fourth-highest daily maximum 8-hour average ozone concentrations measured at each monitor within an area over each year must not exceed 0.075 ppm. (effective May 27, 2008) (9) (a) To attain this standard, the 3-year average of the fourth-highest daily maximum 8-hour average ozone concentrations measured at each monitor within an area over each year must not exceed 0.08 ppm. (b) The 1997 standard—and the implementation rules for that standard—will remain in place for implementation purposes as EPA undertakes rulemaking to address the transition from the 1997 ozone standard to the 2008 ozone standard. (c) EPA is in the process of reconsidering these standards (set in March 2008). (10) (a) EPA revoked the 1-hour ozone standard in all areas, although some areas have continuing obligations under that standard ("anti-backsliding"). (b) The standard is attained when the expected number of days per calendar year with maximum hourly average concentrations above 0.12 ppm is < 1. (11) (a) Final rule signed June 2, 2010. To attain this standard, the 3-year average of the 99th percentile of the daily maximum 1-hour average at each monitor within an area must not exceed 75 ppb.
USA - National Ambient Air Quality StandardsUS EPA, http://www.epa.gov/air/particlepollution/standards.html Primary standards set limits to protect public health.Secondary standards set limits to protect public welfare, including protection against visibility impairment, damage to animals, crops, vegetation, and buildings. (1) Due to a lack of evidence linking health problems to long-term exposure to coarse particle pollution, the agency revoked the annual PM10 standard in 2006 (effective December 17, 2006). (2) Not to be exceeded more than once per year on average over 3 years. (3) To attain this standard, the 3-year average of the weighted annual mean PM2.5 concentrations from single or multiple community-oriented monitors must not exceed 15.0 µg/m3. (4) To attain this standard, the 3-year average of the 98th percentile of 24-hour concentrations at each population-oriented monitor within an area must not exceed 35 µg/m3 (effective December 17, 2006).
Děkuji za pozornost… www.chmi.cz cernikov@chmi.cz Foto: Z. Blažek