Interpolation, extrapolation and regression
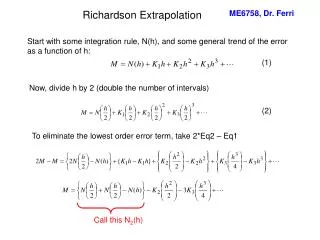
Interpolation, extrapolation and regression. Interpolation is mathematically contrasted to regression or least-squares fit As important is the contrast between interpolation and extrapolation Extrapolation occurs when we are outside the convex hull of the data points

Interpolation, extrapolation and regression
E N D
Presentation Transcript
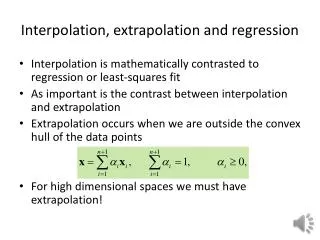
Interpolation, extrapolation and regression • Interpolation is mathematically contrasted to regression or least-squares fit • As important is the contrast between interpolation and extrapolation • Extrapolation occurs when we are outside the convex hull of the data points • For high dimensional spaces we must have extrapolation!
2D example x = rand(20,1); y = rand(20,1); plot(x,y, '.'); k = convhull(x,y) hold on, plot(x(k), y(k), '-r'), hold off Number the points in the Figure and give a couple of Alternative sets of alphas Approximately for the point (0.4,0.4)
Prediction variance • Linear regression model • Define then • With some algebra • Standard error
Example 4.2.1 • For a linear polynomial RS y=b1+b2x1+b3x2find the prediction variance in the region • (a) For data at three vertices (omitting (1,1))
Interpolation vs. Extrapolation • At origin . At 3 vertices . At (1,1)
Standard error contours • Minimum error • What is special about this point x=[-1 -1 1]; y=[-1 1 -1]; [X,Y]=meshgrid(-1:0.1:1, -1:0.1:1); Z=sqrt(0.5*(1+X+Y+X.^2+Y.^2+X.*Y)); v=linspace(0.6,1.8,7) scatter(x,y,'filled'); grid on; hold on [C,h]=contour(X,Y,Z,v); clabel(C,h)
Data at four vertices • Now • And • Error at vertices • At the origin minimum is • How can we reduce error without adding points?
Comparison Three points Four points