Download
1 / 18
180 likes | 205 Views
Explore the evolution of forward short rates from 1 to 3 periods, through binomial tree and price tree analyses. Discover insights into pricing cash flows and adjusting spreads. Art accompanying Marshall and Tucker's Option-Adjusted Spread. Learn about calibrated binomial trees and volatility-induced errors.

E N D
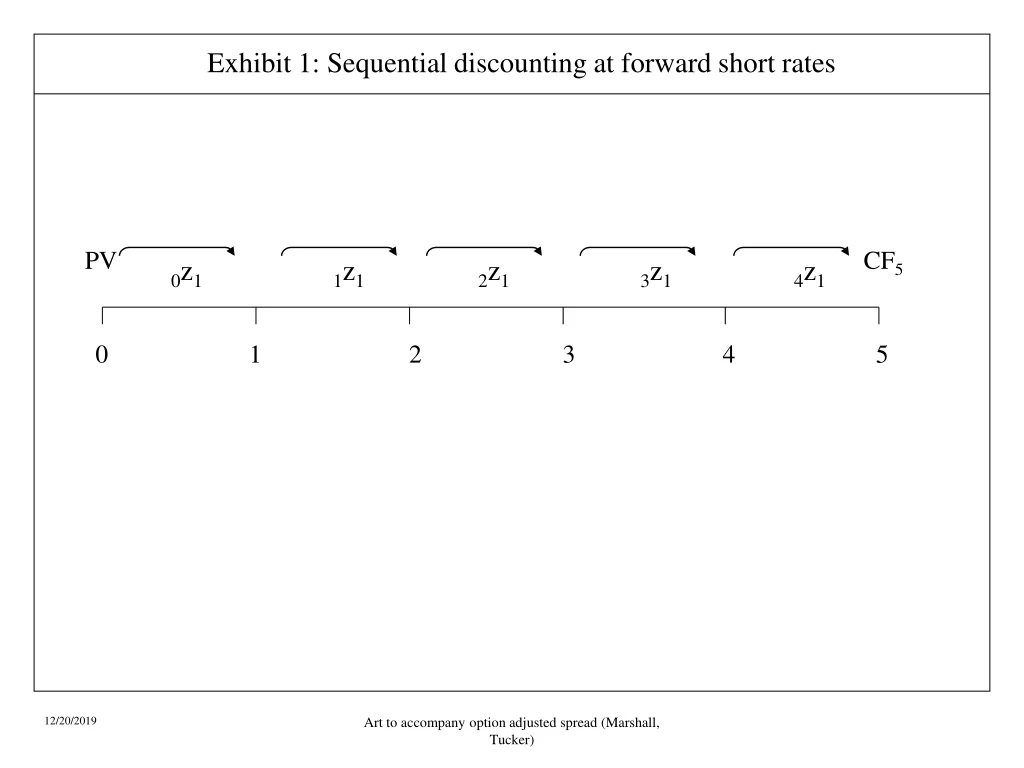
Exhibit 1: Sequential discounting at forward short rates PV CF5 0z1 1z1 2z1 3z1 4z1 0 1 2 3 4 5 Art to accompany option adjusted spread (Marshall, Tucker)
Exhibit 2: Evolution of forward short rates Art to accompany option adjusted spread (Marshall, Tucker)
Exhibit 3: Evolution of a 1-period forward short rate to the realizable short rates. 6.439% 7.200% 7.961% t1zH1 = 1.10567× 7.200% = 7.961% t1zL1 = 0.89433× 7.200% = 6.439% 0 1 2 3 Art to accompany option adjusted spread (Marshall, Tucker)
Exhibit 4: Evolution of a 2-period forward short rate to the realizable short rates. 6.519% 7.289% 8.059% 8.150% 9.011% 9.963% 0 1 2 3 Art to accompany option adjusted spread (Marshall, Tucker)
Exhibit 5: Evolution of a 3-period forward short rate to the realizable short rates. 6.320% 7.067% 7.902% 7.814% 8.737% 8.836% 9.661% 9.770% 10.802% 11.944% 0 1 2 3 Art to accompany option adjusted spread (Marshall, Tucker)
Exhibit 6: Binomial tree of risk-free short rates 6.320% 6.519% 7.814% 6.439% 8.059% 6.000% 9.661% 7.961% 9.963% 11.944% 0z1 1z1 2z1 3z1 0 1 2 3 Art to accompany option adjusted spread (Marshall, Tucker)
Exhibit 7: Price tree for first cash flow $3.6408 $3.75 $3.75 PV1 = (1 + .06000/2) coupon 6.000% 0 1 Art to accompany option adjusted spread (Marshall, Tucker)
Exhibit 8: Price tree for second cash flow $3.6330 $3.75 PV2(1) = [1 + (.06439/2)] × [1 + (.06000/2)] $3.75 PV2(2)= [1 + (.07961/2)] × [1 + (.06000/2)] PV2 = Prob[PV2 = PV2(i)] × PV2(i) ½ 6.439% $3.5143 $3.75 ½ 6.000% $3.6064 7.961% 0 1 2 Art to accompany option adjusted spread (Marshall, Tucker)
Exhibit 9: Price tree for the third cash flow $3.6316 ½ $3.5053 6.519% ½ 6.439% ½ $3.6047 $3.75 $3.3769 ½ ½ 8.059% 6.000% $3.4510 ½ 7.961% $3.5721 9.963% 0 1 2 3 Art to accompany option adjusted spread (Marshall, Tucker)
Exhibit 10: Price tree for final cash flow $100.5717 ½ $97.0472 6.320% ½ ½ $93.2991 6.519% $99.8489 ½ 6.439% ½ ½ 7.814% $95.5586 $103.75 $89.4842 ½ ½ ½ 8.059% 6.000% $91.0383 $98.9695 ½ 7.961% ½ 9.661% $93.7653 ½ $97.9034 9.963% 11.944% 0 1 2 3 4 Art to accompany option adjusted spread (Marshall, Tucker)
Exhibit 11: Convexity and volatility induced error present value of the second cash flow error = calculated value - actual value volatility introduces a systematic bias in the form of an overestimation of the value of the cash flows. This overvaluation is due to convexity coupled with volatility. V1 calculated value actual value V2 6.439% 7.961% short rate 7.200% Art to accompany option adjusted spread (Marshall, Tucker)
Exhibit 12: Calibrating the binomial tree of short rates present value of the second cash flow 6.439% 6.442% 7.961% 7.964% actual value = calculated value 6.442% 7.964% short rate 7.200% Art to accompany option adjusted spread (Marshall, Tucker)
Exhibit 13: Fully calibrated binomial tree of risk-free short rates 6.338% [ 6.320%] 6.527% 7.835% [6.519%] 6.442% [ 7.814%] [6.439%] 8.069% 6.000% 9.687% [8.059%] [6.000%] 7.964% [ 9.661%] [7.961%] 9.976% 11.976% [9.963%] [ 11.944%] 0z1 1z1 2z1 3z1 0 1 2 3 Art to accompany option adjusted spread (Marshall, Tucker)
Exhibit 14: Price tree for the first cash flow of callable bond $5.0971 $5.25 $5.25 PV1 = (1 + .06000/2) coupon 6.000% 0 1 Art to accompany option adjusted spread (Marshall, Tucker)
Exhibit 15: Price tree for the second cash flow of callable bond $5.0862 $5.25 PV21 = [1 + (.06442/2)] × [1 + (.06000/2)] $5.25 PV22= [1 + (.07964/2)] × [1 + (.06000/2)] PV2 = Prob[PV2 = PV2i] × PV2i 6.442% $4.9200 $5.25 6.000% $5.0490 7.964% 0 1 2 Art to accompany option adjusted spread (Marshall, Tucker)
Exhibit 16: Price tree for the third cash flow of callable bond $5.0841 $4.9072 6.527% 6.442% $5.0464 $5.25 $4.7273 8.069% 6.000% $4.8311 7.964% $5.0006 9.976% 0 1 2 3 Art to accompany option adjusted spread (Marshall, Tucker)
Exhibit 17: Price tree for the final cash flow of callable bond $102.0173 $98.4373 6.338% 6.527% $94.6329 $101.2822 6.442% 7.835% $96.9245 $105.25 $90.7618 8.069% $100.3878 6.000% $92.3365 9.687% 7.964% $95.1021 $99.3038 9.976% 11.9766% 0 1 2 3 4 call date Art to accompany option adjusted spread (Marshall, Tucker)
Exhibit 18: Adjusted price tree for final cash flow of callable bond $101.0000 $102.0173 $97.8081 6.338% $98.4373 $94.2624 6.527% $101.0000 $94.6329 $101.2822 $96.7889 6.442% $90.5504 7.835% $96.9245 $105.25 $90.7618 $92.2713 8.069% $100.3878 6.000% $92.3365 9.687% 7.964% $95.1021 $99.3038 9.976% 11.976% 0 1 2 3 4 call date Art to accompany option adjusted spread (Marshall, Tucker)