Download
1 / 10
0 likes | 8 Views
Learn what Tableau is, its features, uses, and advantages in data visualization. Discover how it helps businesses analyze data efficiently. Get started today!

E N D
What Is Tableau? Definition, Features, Use, and More statanalytica.com
In today’s data-driven world, businesses and professionals rely on powerful analytics tools to make informed decisions. One of the most widely used tools in the field of data visualization and business intelligence is Tableau. Tableau simplifies the process of analyzing vast amounts of data and presenting insights in an interactive and visually appealing format. It is popular among business analysts, data scientists, marketing professionals, and even students learning data analytics. 💡 Need Tableau Assignment help? Get expert guidance for accurate solutions!
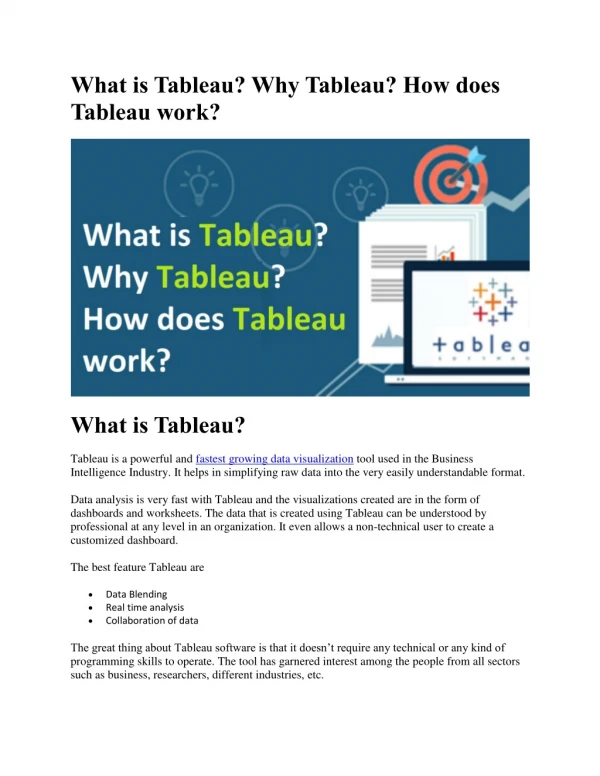
What Is Tableau? Tableau is a leading data visualization and business intelligence (BI) tool that enables users to connect, analyze, and visualize data with ease. This software allows organizations to transform raw data into meaningful insights through interactive dashboards and reports. Whether you’re working with spreadsheets, databases, cloud data, or even big data, Tableau provides an intuitive interface to explore, analyze, and present data effectively. 💡 Did You Know? Tableau was founded in 2003 and later acquired by Salesforce in 2019, further enhancing its capabilities in AI-driven analytics.
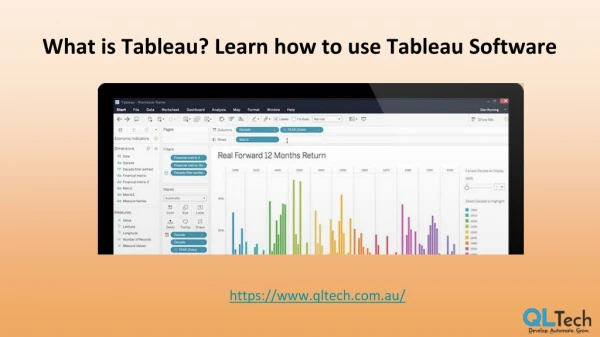
Key Features of Tableau Tableau stands out from other analytics tools because of its user-friendly design and powerful capabilities. Some of its most important features include:- Interactive Dashboards: Users can create visually appealing, interactive reports with drag-and-drop functionality. Real-Time Data Analysis: Tableau supports live data connections, enabling users to track data changes instantly. Multiple Data Source Integration: It connects seamlessly with Excel, SQL databases, cloud services, Big Data platforms, and more. AI-Powered Insights: With machine learning and AI capabilities, Tableau provides smart recommendations to uncover hidden patterns. Collaboration & Sharing: Users can publish reports online or within their organization for easy access. Mobile Compatibility: Dashboards are responsive and can be accessed on tablets and smartphones without losing functionality.
Uses of Tableau Tableau is widely used across industries to simplify complex data analysis. Here’s how different professionals leverage Tableau for decision-making: Business Analysts & Managers: Create insightful reports to track company performance, sales, and revenue trends. Data Scientists & Researchers: Analyze massive datasets and perform predictive analytics for strategic planning. Marketing Teams: Visualize marketing campaigns, measure customer engagement, and track key performance indicators (KPIs). Finance & Banking: Monitor financial statements, risk management, and fraud detection with real-time dashboards. Healthcare & Education: Track patient data, student performance, and institutional growth with effective visual reports. Tableau is a versatile tool that helps professionals make informed, data-backed decisions quickly and efficiently.
Different Tableau Products 1. Tableau Desktop A powerful tool for individuals and businesses to create reports, dashboards, and perform deep data analysis. 2. Tableau Server Designed for organizations to share and collaborate on reports securely across teams. 3. Tableau Online A cloud-based solution that allows users to access and share dashboards from anywhere. 4. Tableau Public A free version for users who want to learn Tableau and share reports publicly. 5. Tableau Prep A tool specifically designed for data cleaning and preparation before analysis.
Advantages of Using Tableau Tableau is widely preferred over other analytics tools due to its ease of use and powerful analytics capabilities. Some of the key advantages include: Easy to Learn & Use: Unlike other BI tools, Tableau doesn’t require coding knowledge—just drag and drop elements to create stunning dashboards. Handles Large Data Efficiently: It processes millions of data rows without slowing down. Secure & Scalable: Works for both individual users and large enterprises with high security. AI-Powered Data Insights: With Tableau AI, users get smart recommendations to make better business decisions. Strong Community Support: Tableau has a large user community, offering forums, resources, and training materials for learners.
How to Get Started with Tableau? If you’re new to Tableau, here’s a simple guide to help you begin: Download Tableau – Get the free trial from Tableau.com. Explore Sample Datasets – Use built-in datasets to practice creating visualizations. Build Your First Dashboard – Utilize drag-and-drop features to create simple reports. Take Online Courses – Enroll in free and paid courses to enhance your Tableau skills. Join the Tableau Community – Engage with other users through forums, webinars, and events. Whether you’re a student or a professional, learning Tableau can significantly boost your career opportunities in data analytics.
Final Thoughts Tableau is one of the most powerful data visualization tools available today, offering real-time analytics, AI-powered insights, and interactive dashboards for various industries. If you're looking to master data visualization and business intelligence, Tableau is the perfect tool to start with!
Thank You! statanalytica.com