Download
1 / 22
220 likes | 323 Views
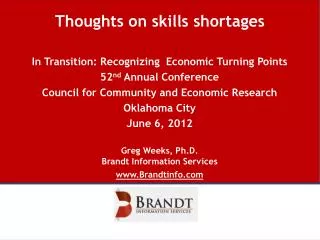
Indiana School Counselors Association Fall Conference - 2001. “The Quiet Dilemma” SKILLS SHORTAGES, HIGHER EDUCATION & TODAY'S YOUTH. Kenneth Gray Penn State University. The Technical Work Force. Blue-Collar Tech. Workers. Professional. 25%. 56%. 19%. Technicians.

E N D
Indiana School Counselors Association Fall Conference - 2001 “The Quiet Dilemma” SKILLS SHORTAGES, HIGHER EDUCATION & TODAY'S YOUTH Kenneth Gray Penn State University
The Technical Work Force Blue-Collar Tech. Workers Professional 25% 56% 19% Technicians Other Ways to Win
A region that does not have a growing percentage of it non-professional workforce trained beyond high school level will have increasing difficulty in supporting the competitiveness of high- value business. Building a World-Class Technical Workforce, 1996 Other Ways to Win
The Quiet Dilemma • University Graduation Rate = 52% • University underemployment rate = 43% • Baccalaureate Success rate = 1 in 4.
The Nation’s Quiet DilemmaUnderemployment of University Graduates • 43% of grads in high school jobs two yrs later • 43% in jobs with no career potential 4 yrs later • 69% of arts and science majors in jobs with no career potential 4 yrs later Source: B&B 1st & 2nd follow-up, NCES 93/97
Employment Outlook for University Graduates2006 Supply Demand Commensurate Employment Bachelors 1,268,000 734,300 57%
Recommending College in Sophomore Years for 1982 and 1992 High School Graduates Father Mother Guidance Teachers Counselor 1982 1992 1982 1992 1982 1992 1982 1992 Total 59.1 77.0 64.8 82.9 32.3 65.2 32.3 65.5 Test Quartile 40.4 59.9 47.6 64.7 26.1 59.4 28.2 57.2 Lowest Second 49.7 71.7 55.6 79.3 26.1 61.1 26.5 60.7 Source: HS &B base year student survey (1980) and NELS:88 first follow-up student survey (1990), National Center for Education Statistics, U.S. Department of Education Other Ways to Win
Sources of Labor Market Advantage High Skill/ High Wage Low Skill/ Low Wage Other Ways to Win
Effects of Skills on Productivity in Non Clerical-N 12 10 8 6 Success in Training 4 Productivity 2 0 Technical Clerical Compute Math Science Verbal Speed Speed Reasoning Other Ways to Win
Sources of Labor Market Advantage High Skill/ High Wage Low Skill/ Low Wage Other Ways to Win
Occupational Groups Ranked by Earnings Earnings Managerial/Professional 1 Craft, Precision Metal, Repair 2 Technical Support 3 Service 4 Operative, Laborer 5 Farming, Fishing 6 Source: Compiled from Eck, (1994) & Statistical Abstracts U.S. 1994.
Occupational Groups Ranked by Earnings, Net Openings Earning Openings Managerial/Professional 1 Technical Support 1 Craft, Precision Metal, Repair 2 Operative, Laborer 2 Technical Support 3 Craft, Precision Metal, Repair 3 Service 4 Service 4 Operative, Laborer 5 Farming, Fishing 5 Farming, Fishing 6 Managerial/Professional 6 Source: Compiled from Eck, (1994) & Statistical Abstracts U.S. 1994.
A New Goal • Stop counting the number of teens who go to college and start counting how many are successful. • Every student should graduate with a postsecondary plan that has a high probability of success.
Today Success Requires Academic Skills & Career Direction
Where High School Seniors Expect to be Employed OccupationsAll Seniors MalesFemales Professional 59.0 49.3 68.8 Manager 6.0 6.6 5.4 Craft/Precision manufacturing/ 2.8 5.3 0.3 Specialized repair Technicians 6.0 8.4 3.7 Source: U.S. Department of Education Other Ways to Win
All my life I’ve always wanted to be somebody, but I see now I should have been more specific. Wagner, 1986 Other Ways to Win
Old Advice that is Now Bad Advice • Postpone career choices as long as possible You don’t want to close any doors. • Don worry about career indecision you will decide that in college. (The difference between acceptance into college and acceptance into a major).
Career Development Basics • Not our role to tell teens and parents what they should or should not do. It is our role to help them make the best decision they can. • Remember the difference between jobs and careers. • Remember fastest growing occupations may not mean the greatest opportunity.
Student Outcomes Goals of Career Development Programs • Help teens make the best career decision they can based on what they know “now” about themselves and the world of work. If this is a good decision, the next decision will be even better.
Student Outcomes Goals of Career Development Programs • By the tenth grade all students will have participated in activities designed to help them identify several career options. • In the eleventh and twelfth grades all students will participate in activities that allow them to verify these choices, using the results to develop postsecondary plans.
Four Messages for Students and Parents 1. Focus on postsecondary success, not college admissions. 2. Take career exploration seriously—career direction predicts success. .3. If one goal is economic security, then don’t confuse education with occupational skills. 4. Consider two-year postsecondary technical education and apprenticeship training that can lead to a four-year college degree. Other Ways to Win