Download
1 / 19
190 likes | 375 Views
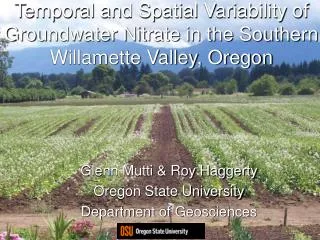
Temporal and Spatial Variability of Groundwater Nitrate in the Southern Willamette Valley, Oregon. Glenn Mutti & Roy Haggerty Oregon State University Department of Geosciences. Introduction. Overview of previous spatial and temporal studies Sampling Network Results and Implications

E N D
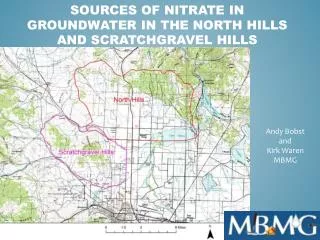
Temporal and Spatial Variability of Groundwater Nitrate in the Southern Willamette Valley, Oregon Glenn Mutti & Roy Haggerty Oregon State University Department of Geosciences
Introduction • Overview of previous spatial and temporal studies • Sampling Network • Results and Implications • Modeling Nitrogen Dynamics • Conclusions
Prior Documentation of Temporal Variability (From Faega et al., 2004)
Hypothesis • Seasonal precipitation should impact shallow groundwater nitrate concentrations • Why should it matter? • Distinguish seasonal trends vs. actual trends in monitoring data • Determine optimal sampling periods
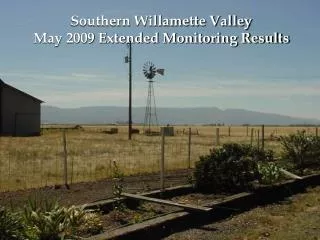
Monitoring Network • 19 wells sampled monthly for 15 months • 15 residential wells • 4 monitoring wells • Well log extant • Well Depth ≤ 50 ft • Screening Interval ≤ 15 ft • Pass Coliform bacteria test
Was there Seasonal Variability? • Yes, precipitation influences nitrate values • However, seasonal wetting patterns are critical!
Wetting Up Period Necessary to have NO3- Response • Used water levels to indicate when recharge occurred • Soil needs to wet up before recharge, then groundwater nitrate values respond to precipitation
n = 6 n = 6 n = 7 n = 9 n = 10 Sample Distributions Based on Geology and Soil Qal = Holocene Floodplain and Alluvial Deposits Qs = Pleistocene Alluvium and Flood Deposits FSL= Fine Sandy Loam SCL= Silty Clay Loam SL= Silt Loam n = 6 n = 6 n = 6
Modeling Goals • Calibrate SWAT so that reasonable outputs are obtained and validated • Examine different land management options and their impact on leached nitrate • Examine future scenarios and the impacts of nitrate Best Management Practices
DEM LULC Soils SWAT GIS Inputs
Non-GIS Model Inputs • Climate Data • River flows originating from non-modeled areas • Land Management Practices
Cascades Coast Range Modeled Area & Pre-Calibration Results
Closing Points • Relationship between NO3- and precipitation may be biased by data set: needs further analysis • Data uncertainties have yet to be analyzed • Small sample size could limit the significance of results
Conclusions • Nitrate concentrations in the Southern Willamette Valley are dynamically linked to precipitation during recharge months • The recharge month with the highest annual precipitation is likely to have the highest annual groundwater NO3-concentration (but also the highest variability!!) • Wells drilled in different geologic formations or soil classes are likely to exhibit different seasonal variabilities
Acknowledgements: • Funding provided by: USGS Small Grants Program, Award No. 01HQGR0145 • SWAT Development: USDA ARS and Blackland Research Center, Texas A&M University