Figure 29.1
360 likes | 526 Views
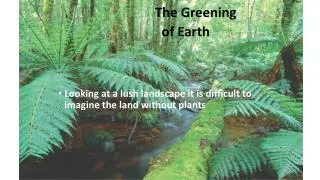
Figure 29.1. The Greening of Earth Looking at a lush landscape it is difficult to imagine the land without plants . For first 3 billion years of Earth’s history -terrestrial surface was lifeless.

Figure 29.1
E N D
Presentation Transcript
Figure 29.1 The Greening of Earth • Looking at a lush landscape it is difficult to imagine the land without plants
For first 3 billion years of Earth’s history -terrestrial surface was lifeless
CYTOPLASM CELL WALL 3 Response 1 Reception 2 Transduction Activation of cellular responses Relay molecules Receptor Hormone or environmental stimulus Plasma membrane Figure 39.3 • The potato’s response to light • Is an example of cell-signal processing
1Reception 3Response Transcription factor 1 CYTOPLASM NUCLEUS Specific protein kinase 1 activated cGMP Plasma membrane P 2 Transduction Second messenger produced Transcription factor 2 Phytochrome activated by light 2 One pathway uses cGMP as asecond messenger that activatesa specific protein kinase.The otherpathway involves an increase incytoplasmic Ca2+ that activatesanother specific protein kinase. P Cell wall Specific protein kinase 2 activated Transcription Light Translation 3 Both pathwayslead to expression of genes for proteinsthat function in thede-etiolation(greening) response. 1 The light signal isdetected by thephytochrome receptor,which then activatesat least two signaltransduction pathways. De-etiolation (greening) response proteins Ca2+ channel opened Ca2+ • Signal transduction in plants Figure 39.4
Haploid multicellular organism (gametophyte) ALTERNATION OF GENERATIONS Mitosis Mitosis n n n n n Spores Gametes MEIOSIS FERTILIZATION 2n 2n Zygote Mitosis Diploid multicellular organism (sporophyte) Alternation of generations* Figure 29.5
Cuticle* (a waxy covering of the leaves) evolved in many plant species
Fossil evidence indicates that plants were on land at least 475 million years ago
Land plants grouped • Based on the presence or absence of vascular tissue*
Life cycles of bryophytes (e.g. moss) dominated by the gametophyte stage
Bryophyte Sporophytes • Dependant on gametophytes
Ferns and other seedless vascular plants* formed the first forests, evolved during Carboniferous period
The growth of these early forests • May have helped produce the major global cooling that characterized the end of the Carboniferous period • Decayed and eventually became coal
1 Sporangia release spores. Most fern species produce a single type of spore that gives rise to a bisexual gametophyte. The fern spore develops into a small, photosynthetic gametophyte. 3 Although this illustration shows an egg and sperm from the same gametophyte, a variety of mechanisms promote cross-fertilization between gametophytes. 2 Key life cycle of a fern – alternation of generations Haploid (n) Diploid (2n) Antheridium Young gametophyte Spore MEIOSIS Sporangium Sperm Archegonium Egg Mature sporophyte New sporophyte Zygote Sporangium FERTILIZATION Sorus On the underside of the sporophyte‘s reproductive leaves are spots called sori. Each sorus is a cluster of sporangia. 6 Fern sperm use flagella to swim from the antheridia to eggs in the archegonia. 4 Gametophyte 5 A zygote develops into a new sporophyte, and the young plant grows out from an archegonium of its parent, the gametophyte. Fiddlehead Figure 29.12
Transport* • Vascular plants have two types of vascular tissue* • Xylem* and phloem*
Xylem* • Conducts water and minerals • Phloem* • Distributes sugars, amino acids, and other organic products • Living cells
Xylem sap Outside air Y = –100.0 MPa Mesophyll cells Stoma Water molecule Leaf Y (air spaces) = –7.0 MPa Transpiration Atmosphere Leaf Y (cell walls) = –1.0 MPa Xylem cells Adhesion Cell wall Water potential gradient Trunk xylem Y = – 0.8 MPa Cohesion, by hydrogen bonding Cohesion and adhesion in the xylem Water molecule Root xylem Y = – 0.6 MPa Root hair Soil Y = – 0.3 MPa Soil particle Water Water uptake from soil Figure 36.13 • Ascent of xylem sap - Transpiration
Source cell (leaf) Vessel (xylem) Sieve tube phloem) 1 Loading of sugar (green dots) into the sieve tube at the source reduces water potential inside the sieve-tube members. This causes the tube to take up water by osmosis. H2O Sucrose 1 H2O 2 2 This uptake of water generates a positive pressure that forces the sap to flow along the tube. 3 The pressure is relieved by the unloading of sugar and the consequent loss of water from the tubeat the sink. Transpiration stream Pressure flow Sink cell (storage root) 4 In the case of leaf-to-root translocation, xylem recycles water from sink to source. 4 3 Sucrose H2O Figure 36.18 Pressure Flow - Translocation • Sap moves through a sieve tube by bulk flow driven by positive pressure
Evolution of Leaves • Increase the surface area of vascular plants, thereby capturing more solar energy for photosynthesis
Guard cells Key to labels Dermal Stomatal pore Ground Vascular Epidermal cell Sclerenchyma fibers 50 µm Cuticle (b) Surface view of a spiderwort (Tradescantia) leaf (LM) Stoma Upper epidermis Palisade mesophyll Bundle- sheath cell Spongy mesophyll Lower epidermis Guard cells Cuticle Vein Xylem Vein Air spaces Guard cells Guard cells Phloem Figure 35.17a–c 100 µm Transverse section of a lilac (Syringa) leaf (LM) (c) (a) Cutaway drawing of leaf tissues Leaf anatomy
Three different experiments helped reveal which wavelengths of light are photosynthetically important. The results are shown below. EXPERIMENT RESULTS Chlorophyll a Chlorophyll b Absorption of light by chloroplast pigments Carotenoids Wavelength of light (nm) (a) Absorption spectra. The three curves show the wavelengths of light best absorbed by three types of chloroplast pigments. Figure 10.9 • Absorption spectra of 3 types of pigments
Light energy ECOSYSTEM Photosynthesisin chloroplasts Organicmolecules CO2 + H2O + O2 Cellular respirationin mitochondria ATP powers most cellular work Heatenergy Figure 9.2 E Transformations Thermodynamics • E flows into ecosystem as sunlight, leaves as heat
Light reaction Calvin cycle H2O CO2 Light NADP+ ADP + P1 RuBP 3-Phosphoglycerate Photosystem II Electron transport chain Photosystem I ATP G3P Starch (storage) NADPH Amino acids Fatty acids Chloroplast O2 Sucrose (export) Calvin cycle reactions: • Take place in the stroma • Use ATP and NADPH to convert CO2 to the sugar G3P • Return ADP, inorganic phosphate, and NADP+ to the light reactions Light reactions: • Are carried out by molecules in the thylakoid membranes • Convert light energy to the chemical energy of ATP and NADPH • Split H2O and release O2 to the atmosphere Figure 10.21 • Review
Figure 30.1 Seeds*changed the course of plant evolution • Enabling their bearers to become the dominant* producers in most terrestrial ecosystems
Pollen*, (dispersed by air or animals *) • Eliminated the water requirement for fertilization
Seed coat (derived from Integument) Food supply (female gametophyte tissue) (n) Embryo (2n) (new sporophyte) (c) Gymnosperm seed. Fertilization initiatesthe transformation of the ovule into a seed,which consists of a sporophyte embryo, a food supply, and a protective seed coat derived from the integument. The Evolutionary Advantage of Seeds*** • A seed *** • Develops from the whole ovule • Embryo, + food supply, packaged in a protective coat* Figure 30.3c
Angiosperm Evolution • Originated at least 140 mya during the late Mesozoic
Symbionts • Symbiotic relationships w/ • Plants, algae, and animals
(a) A fruticose (shrub-like) lichen Figure 31.23a–c (b) A foliose (leaf-like) lichen (c) Crustose (crust-like) lichens Lichens • Symbiotic association of millions of photosynthetic microorganisms held in a mass of fungal hyphae
Ascocarp of fungus Soredia Fungal hyphae Algal layer Algal cell Fungal hyphae Figure 31.24 10 m • Fungi plusalgae or cyanobacteria
EXPERIMENT Researchers grew soybean plants in soil treated with fungicide (poison that kills fungi) to prevent the formation of mycorrhizae in the experimental group. A control group was exposed to fungi that formed mycorrhizae in the soybean plants’ roots. The soybean plant on the left is typical of the experimental group. Its stunted growth is probably due to a phosphorus deficiency. The taller, healthier plant on the right is typical of the control group and has mycorrhizae. CONCLUSION These results indicate that the presence of mycorrhizae benefits a soybean plant and support the hypothesis that mycorrhizae enhance the plant’s ability to take up phosphate and other needed minerals. Figure 31.21 Mycorrhizae • Enormously important in natural ecosystems and agriculture RESULTS RESULTS