The Induced Polarisation (IP) Method
ERTH2020 Introduction to Geophysics. The Induced Polarisation (IP) Method. Induced Polarisation. “equivalent circuits”. Induced Polarisation. -. -. DC Resistivity. +. +. I. I. +. completely described by Ohm’s law. C. -. R. resistance. “capacitance ” (charge / voltage).


The Induced Polarisation (IP) Method
E N D
Presentation Transcript
ERTH2020Introduction to Geophysics The Induced Polarisation (IP) Method
Induced Polarisation “equivalent circuits” • Induced Polarisation - - • DC Resistivity + + I I + completely described by Ohm’s law C - R resistance “capacitance” (charge / voltage)
Induced Polarisation Threemain causes Electrochemical processes at the interface of metallic minerals / pore fluid: presence of ore deposits. Exchange reactions in clay and shaly sands: hydrogeological applications. Reactions involving organic materials: hydrocarbon exploration. • IP - Main Applications: • disseminated metallic ores • porphyry coppers, • bedded lead/zinc • sulphide-related gold deposits • environmental related studies • geothermal exploration Veeken et al., 2009 ; Reynolds, 2011
Induced Polarisation • The earliest observation (1913)of the induced polarization phenomenon associated with sulphide mineralization is attributed to Conrad Schlumberger who observed that if he passed a DC current through rocks containing metallic sulphides and interrupted the current abruptly, the resultant voltages in the Earth decayed slowly rather than instantly. • Today IP is the primary tool used to explore for several important types of mineral deposits—especially porphyry coppers, bedded lead/zinc and sulphide-related gold deposits. • IP is unique among the controlled-source geophysical methods employed in mineral exploration in that it is based on an interface electrochemical phenomenon, rather than on a purely physical property of rocks or minerals. Seigel et al, 2007
Induced Polarisation Seigel et al, 2007
Induced Polarisation DC & IP over polymetallic deposit in the Altai region (USSR) in the late 1960s (Schlumberger array with AB = 1200 m and MN = 20 m ). Charging current was 2 minutes and the integration time was 0.5 s. [...] The deposit does show as a minor resistivity depression, but is much more clearly indicated by its IP response, both in the time and frequency domains. Seigel et al, 2007
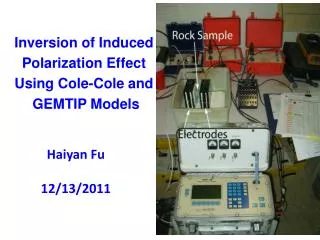
Induced Polarisation Principally with the same equipment as Resistivity Measurements: P2 C1 P1 C2
Induced Polarisation • DC resistivity • direct electrical connection (electrodes) • flow of current • electrical potential in the ground P2 C1 P1 C2 • IP methods • direct electrical connection (electrodes) • flow of current switched off • decay of electrical potential
Reconnaissance or deep IP surveys often use large current electrodes buried in deep, saline-filled holes (Hence the benefit of electrode arrays where the current electrodes do not need to be moved for each reading). Induced Polarisation Small IP surveys often use porous-pot type electrodes (Telford, 1990)
IP surveys usually use a separate transmitter and receiver Power requirements are higher than for DC res. surveys Cables and electrodes must be watched. If a passer-by or animal touched the current electrodes during data acquisition, this could be fatal Induced Polarisation
IP Effect IP-Effect: (below 1kHz or greater than 1 ms) • If a DC current injected into the ground is abruptly switched off, the voltage measured at the potential electrodes does not immediately drop to zero! P2 C1 P1 C2
IP Effect Vp Steady state voltage: (primary voltage) Vs Residual voltage: (secondary voltage) charge time IP effect
Voltage shows a large initial decrease, then decays slowly over a timescale of seconds (minutes). This is the IP effect The rate of decay depends on the electrical properties of the ground and the presence of metallic minerals The decay voltage is the result of storage of energy by the ground during the period when the DC current is on The effect cannot be explained in terms of the atomic or molecular structure of the material, but depend on the macro-structure. IP Effect
Chemical energy is the main source of the IP effect which is stored by subsurface structures in two main ways: Electrodepolarisation(overvoltage) (~below 1kHz) Related to the transition between electrolytic and electronic conduction at the interfaces between pore fluids and metallic minerals in the rock Larger than the normal IP effect Requires presence of metallic minerals (or graphite) Membranepolarisation(electrolytic) (~below 1Hz) Due to variations in the mobility of ions contained within pore fluids Called the “normal” IP effect May occur in rocks which contain no metallic minerals IP Effect – Sources
IP Effect – Electrode Polarisation • Electrode (or grain) polarisation • same process as self-potential. • Metal electrode in an ionic solution: • No voltage applied: • charges with different polarities separate • potential difference between electrode and solution. • With voltage applied: • currents start flowing • change in potential difference • Voltage turned off: • ions diffuse back to equilibrium • The total magnitude of the potential is the Nernst potential and the adsorbed layer gives rise to the Zeta potential Reynolds, 2011, p.374
Electrode polarisation occurs when electricity is conducted partly electrolytically and partly electronically IP Effect – Electrode Polarisation Electrolytic conduction only (no IP) Electrolytic and electronic conduction • When metallic mineral grains block the pore spaces in a rock, an electrochemical barrier must be overcome in order for current to flow across the grain surfaces • Ions accumulate at grain surfaces and the grains become Polarised • When the current flow is interrupted, ions return to their equilibrium positions voltage decay
Many minerals (e.g. clays) have a net -ve charge at the interface between mineral surface and pore fluid +ve ions are attracted to the surface and -ve ions repelled Build-up of a layer (“cationic cloud”) of +ve ion concnwhich may extend 1 mm into the pore fluid IP Effect – Membrane Polarisation (Equilibrium: No applied electrical field)
Zone of +ve ion concn may extend 1 mm into pore fluid: if the pore has diameter < 1 mm, then, when a voltage is applied, -ve ions will accumulate on one side of the pore and leave the other When the voltage is removed, the ions return to their equilibrium positions voltage decay Membrane polarisation is largest when a rock contains clay materials scattered through the matrix in small (~10%) concentrations and in which the electrolyte has some salinity IP Effect – Membrane Polarisation ( Applied electrical field)
IP effect depends on grain size Large sulphide grain → large amount of current through it, but small surface/volume ratio IP however is a function of the amount of grain surface exposed to the electrolytic solution Therefor, as the grain size is reduced, the IP effect increases However for very small grain sizes, the surface resistance is too large greatest IP effect for intermediate values of sulphide grain sizes IP Effect – Electrode Polarisation IP observed in mixtures of pyrite and quartz sand for various pyrite grain sizes (Keller and Frischknecht, 1966)
In practice, it is not possible to distinguish between membrane and electrode polarisations on the basis of geophysical IP measurements Membrane polarisation may give rise to a “background” IP effect equivalent to 0.1% - 10% conductive minerals (typically 1% - 2%) IP is a bulk effect: it does not depend on atomic-scale rock or mineral properties IP Effect – Sources
Electrode polarisation depends strongly on the surface area The IP method is more sensitive to disseminated conductors than to massive ones This sets the IP method apart from the DC resistivity and EM (electromagnetic) methods, which typically give a weak response over a disseminated target IP Effect – Sources Time-domain IP profile using a pole–dipole array over the Gortdrum copper–silver body in Ireland Chargeability Apparent resistivity (P. Kearey et al., 2007)
IP measurements can be made in either the time-domain or frequency-domain (frequency-domain IP won’t be covered today) An advantage of time-domain systems is that measurements can be made over several transmitter cycles and then averaged (or stacked). This process reduces the effect of random noise. Current and potential electrodes are arranged as for a normal DC resistivity survey In time-domain (TD) systems, the transmitter current is abruptly switched off, and the decaying voltage due to the IP effect is measured at a series of delay times Time-Domain IP Measurements
Typical transmitted and received waveforms in time-domain Time-Domain IP Measurements Charging time Off-time
Effect of chargeable ground Time-Domain IP Measurements University of British Columbia (UBC-GIF)
In time-domain IP, the main parameters used to present and interpret data are apparent resistivity (ra) and chargeability (m) mis a macroscopic physical parameter which represents all of the microscopic phenomena. The apparent resistivity is calculated as for DC resistivity using the voltage measured before the transmitter is switched off (denoted Vp) The measured Vp for a short charging time will be less than that measured for a long charging time - this means that ra calculated for a high frequency Tx waveform will be less than that for a low frequency Tx waveform (the frequency-domain IP effect) Time-Domain IP Measurements K = geometric factor (depends on electrode array) VP depends on the “charging time”
In practice it is impossible to measure Vs (the voltage at current switch-off) Instead, after an initial delay (500 msec), the decay voltage is measured at a series of (typically four) delay times. Measured voltages are then used to approximate the area under the decay curve Time-Domain IP – Chargeability • The ratio Vs/Vp is called the chargeability (Units: millivolts per volt)
The apparent chargeability, ma, is defined by where tn is the time corresponding to the last voltage measurement (on the previous slide, n = 4) and V(t) is the decay voltage at time t The apparent chargeability is the area under (part of) the voltage decay curve, divided by the “primary” voltage Vp In practice, the units are milliseconds (ms) The apparent chargeability depends on the actual values of t1 and tn, and may be different for different field instruments Time-Domain IP – Apparent Chargeability (Units: milliseconds)
Apparent chargeability also depends on the charging time (long charging times give larger decay voltages) A highly polarisable earth will give rise to a longer IP decay and hence a large chargeability Because of the practical considerations outlined, the apparent chargeability isn’t equal to the actual chargeability of the ground, even in the case of a uniformly polarisable earth. Note that the DC resistivity measurement made in the course of an IP survey is useful data. Chargeability is usually interpreted together with the resistivity data. Time-Domain IP – Apparent Chargeability
Chargeabilities of rocks material material mineral m (ms) m (ms) m (ms) 1% Volume concentration Charging time 3 seconds Integration 1 second Charging time 1 minute Integration 1 minute Charging time 3 seconds Integration 0.02 to 1 second (from Telford et al., 1990)
Any of the common DC resistivity electrode arrays may be used for IP surveys - the two most commonly used are the dipole-dipole and gradient arrays. For mineral exploration, the gradient array is similar to the Schlumberger array, except that the potential electrodes do not have to be kept in-line with the current electrodes Electrode arrays: Gradient Plan View A,B current electrodes (fixed) M,N potential electrodes (roving) Because the current electrodes are not moved, the gradient array is useful for reconnaissance surveying of relatively large areas
With the dipole-dipole array, measurements of apparent resistivity and apparent chargeability are made at several “n-spacings” for each current electrode setup Electrode arrays: Dipole-dipole n = 1, 2, 3, etc.
Dipole-dipole IP data are commonly displayed as separate pseudosections of apparent resistivity and apparent chargeability 2D electrical imaging surveys 24 msec (n=4) n-spacing n-spacing Rocky’s Reward, WA (NiS), 1986, dipole-dipole 15 ohm-m (Mutton and Williams, 1994)
Combine vertical (sounding) and lateral (profiling) survey method This provides a 2D geoelectrical model of the subsurface: vertical and horizontal changes in electrical properties assumption: no changes perpendicular to survey line Typical 1D sounding surveys involve 10 – 20 readings Typical 2D imaging surveys involve 100 – 1000 readings In comparison, 3D would involve several 1000’s of readings 2D electrical imaging surveys
Pseudosections are a convenient means of plotting data acquired using a variety of current and potential electrode separations in a single plot They do not represent true cross-sections of ra and ma, except in the sense that the depth of penetration increases as the “n-spacing” increases As a rough rule-of-thumb, the depth of investigation is ( na / 2 ) for the dipole-dipole array Although pseudosections are useful for displaying data and for assessing data quality, the resistivity and chargeability pseudosections do not provide a realistic portrayal of the true subsurface distributions of these parameters 2D electrical imaging surveys
Dipole-Dipole – combine Sounding and Profiling 2D electrical imaging surveys 45°
Horizontal location of data point at mid-point of set of electrodes used Vertical position (pseudo-depth) of data point at a depth proportional to electrode spacings The measured parameter is plotted at the intersection of 45° lines extending from the mid-points of the transmitter and receiver pairs Note that this is a convention only and does not constitute the depth of investigation 2D electrical imaging surveys
Centenary gold deposit, WA (disc. 1996) 2D electrical imaging surveys • The Centenary gold deposit is a concealed ore body located 110 km north of Leonora, Western Australia • The ore body is associated with sulphides and is hosted in the magnetic portion of the Mount Pickering Dolerite. • Due to its sulphidic nature, both gravity and induced polarization (IP) were trialled soon after discovery. • A dipole–dipole IP and resistivity survey detected a significant chargeability anomaly over Centenary. survey line drill holes ore body high chargeability (ore body) conductive overburden low resistivity (ore body) Pittard and Bourne, Exploration Geophysics, 2007, 38, 200–207
Centenary gold deposit, WA (disc. 1996) 2D electrical imaging surveys Example electrode polarisation survey line drill holes ore body high chargeability (ore body) conductive overburden low resistivity (ore body) Pittard and Bourne, Exploration Geophysics, 2007, 38, 200–207
The most common method of interpretation of IP data is via automatic two-dimensional inversion Inversion of IP data results in cross-sections of resistivity and chargeability vs depth, which are similar to geological cross sections Inversion of the data is performed in “real time” by some instruments, and inverted sections are now a standard product delivered by geophysical contractors NB Remember resolution, suppression of features and model equivalence apply to any best-fit geophysical model, so be prepared to supply the relevant modelling information (or ask your contractor to do so) IP Data Interpretation
The Century deposit, approximately 250 km north-northwest of Mt. Isa in northwest Queensland, Australia, is hosted by relatively flat-lying middle Proterozoic siltstone and shale units. Mineralization occurs preferentially within black shale units as fine-grained sphalerite and galena with minor pyrite. The recovered model after inversion shows the superposed geologic section. The inversion nicely delineates the resistive overburden of limestones on the right. The resistivity at depth is not correlated with mineralization, however. IP Data Interpretation Example electrode polarisation observed data 2D inversion observed data 2D inversion
IP Data Interpretation Example electrode polarisation observed data 2D inversion observed data 2D inversion http://www.eos.ubc.ca/ubcgif/iag/casehist/century/intro.html
IP Data Interpretation Example membrane polarisation Induced-polarization detection and mapping of contaminant plumes • 2D time-domain IP & DC Resistivity mapping of a contaminant plume at the Massachusetts Military Reservation. • The plume consists of approximately 265 m3 of fuel that erupted from a broken underground pipeline in the early 1970s. • Benzene and ethylene dibromide (EDB) are the primary contaminants exceeding the allowed maximum concentration levels. EDB (10) EDB (100) monitoring wells survey line EDB (0.02) Plan view of the plume site, indicating existing wells; geologic section line CC', IP survey line, as well as the ethylene dibromide (EDB) concentration plot Sogade et al, 2006
IP Data Interpretation Example membrane polarisation Geological Cross-Section EDB (0.02) EDB (10) EDB (100) Sogade et al, 2006
IP Data Interpretation Example membrane polarisation EDB (100) Dipole-dipole pseudosection, electrode separation a = 24.38 Extrapolated plume concentration data for benzene and EDB based on ground-monitoring wells Sogade et al, 2006
IP Data Interpretation Example membrane polarisation 2D resistivity Section Conductive zone ~1000 (Groundwater?) EDB (100) Conductive zone ~300 (Clays?) Log Resistivity () 2D IP Section EDB (100) Chargeability Anomalies (Contaminants ?) Chargeability (mV/V) Sogade et al, 2006
The IP effect, voltage decay after switching off a DC voltage and membrane polarisation and electrode polarisation mechanisms a sources of this effect. Time-domain IP measurements, Tx and Rx waveforms Determination of apparent chargeability Display of IP data, pseudosections and depth of investigation Inversion and interpretation of resistivity and chargeability results Summary
References Veeken P.C.H., Legeydo P.J., Davidenko Y.A, Kudryavceva E.O, Ivanov S.A., Chuvaev A.: “Case History: Benefits of the induced polarization geoelectricmethod to hydrocarbon exploration”, 2009, Geophysics, V74, p. B47–B59 Telford, W.M, Geldart, L.P., Sheriff, R.E.: “Applied Geophysics”, 1991, Cambridge University Press Reynolds, J.M., "An Introduction to Applied and Environmental Geophysics", 2011, John Wiley & Sons Seigel H., Nabighian M., Parasnis D., Vozoff K., “The early history of the induced polarization method”, March2007, The Leading Edge, pp. 312 Sogade, J.A, Scira-Scappuzzo F., Vichabian Y., “Induced-polarization detection and mapping of contaminant plumes”, 2006, Geophysics, V71, p. B75–B84
Assumption: the ultimate effect of chargeabilityis to alter the effective conductivity(resistivity) when current is applied (Seigel, 1959). This assumption permits the IP responses to be numerically modelled by carrying out two forward modellings using a DC resistivity algorithm IP Data Interpretation potential including chargeability effects measured potential in the absence of chargeability effects the apparent chargeability can be computed by carrying out two DC resistivity forward modellings with conductivities and D.W. Oldenburg and Y. Li, 1994, "Inversion of induced polarization data", Geophysics, 59, P.1327-1341