Download
1 / 35
350 likes | 468 Views
IEEE C SE2013. Synthesizing Social Proximity Networks by Combining Subjective Surveys with Digital Traces. Christopher Barrett*, Huadong Xia*, Jiangzhuo Chen*, Madhav V. Marathe *, Henning S. Mortveit * and Marcel Salathe #

E N D
IEEE CSE2013 Synthesizing Social Proximity Networks by Combining Subjective Surveys with Digital Traces Christopher Barrett*, Huadong Xia*, Jiangzhuo Chen*, Madhav V. Marathe*, Henning S. Mortveit* and Marcel Salathe# * The Network Dynamics and Simulation Science Laboratory, Virginia Bioinformatics Institute at Virginia Tech, USA # Center for Infectious Disease Dynamics, Penn State University, USA
Acknowledgement We thank our external collaborators and members of the Network Dynamics and Simulation Science Laboratory (NDSSL) for their suggestions and comments. This work has been partially supported by DTRA Grant HDTRA1-11-1-0016, DTRA CNIMS Contract HDTRA1-11-D-0016-0001, NIH MIDAS Grant 2U01GM070694-09, NSF PetaApps Grant OCI-0904844, NSF NetSE Grant CNS-1011769.
Background: Model Close Proximity Relations Between People • Close proximity relations between people are critical in understanding the diffusion of influenza-like epidemics. • Those close proximity relations are modeled collectively as a social contact network. • Existing solutions in constructing social contact networks: • Digital devices to detect proximity between people: RFID tags, cell phones, motes, etc. • Subjective assessment and survey information Modeling Social contact network Social contact network
Solution 1: Digital Devices to Detect Proximity Between People Expensive Free of human error Nontrivial to generalize High quality 700-student contact Network => 1000-student contact Network?
Solution 2: Subjective Assessment and Survey Information Complete Graph G(n,p) Inexpensive Geometry Random Graph Subjective Assessment … … Easy to generalize Sublocation interactions remains a black box
New Solution: A Hybrid Methodology • A hybrid methodology that combines both subjective surveys and digital traces: • Generic pattern exists in a very small location: conference room, class room, restaurant at different hours. • As a Showcase: School networks
Outline • Data sets • Objective 1: understand In-class contact networks • Identifying class intervals • Extracting class networks • Objective 2: generative network model that model the digital trace network • Objective 3: comparison study on the impact of detailed sublocation structure
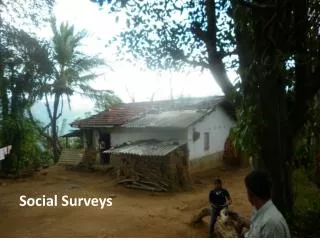
Data Sets: Surveys • Populations: • NRV population: 150K • High school population: 2.5K • We collected class schedules for 3 schools in New River Valley Region
Data Sets: Digital Trace Data • Digital trace data • Collected from an American high school • 788 participants, including 655 students, 73 teachers and 55 staff members, and 5 other people (94% of the school population) • Each participant carry a mote for an entire typical school day. • Their motes detect other motes within 3 meters for every 20 seconds, stored as CPRs in the data set • CPR: close proximity records • CPI: close proximity interaction, a continuous sequence of CPRs • Contacts: a contact is the sum of all CPIs between two motes. • 2,148,991 CPRs, 762,868 CPIs and 118,291 contacts
Outline • Data sets • Objective 1: understand In-class contact networks • Identifying class intervals • Extracting class networks • Objective 2: generative network model that model the digital trace network • Objective 3: comparison study on the impact of detailed sublocation structure
Structure of School Networks • Formation of school networks: • Step to identify class networks: • Identify class periods • For each identified class period, identify within-class contact networks
Challenges (1) • Motes are anonymized and the class schedules are unknown. • Mote Signals are highly volatile • Directional • Unstable device
Challenges (2): Isolate In-Class Contact Networks • Interference exists for sensor Signals! • A very large Connected Component for any snapshot contact networks • Sensor Signals can traverse the wall (via windows/doors)?
Isolate In-Class Contact Networks • CPIs within the same class interval comprise a relative stable contact network, even if CPIs are volatile --- foundation for us to analyze • CPIs traverse across classrooms but we hypothesize: • CPIs between classrooms are short and unstable An “test and try” algorithm to remove noises • CPIs between classrooms are sparser than within • Modularity based Community Detection Algorithm
Analyze In-class Contact Network • Students in the class typically form into one or multiple groups; students of the same group are highly connected. • Duration of CPIs follow a power law like distribution 21 nodes 32 nodes 47 nodes
Outline • Data sets • Objective 1: understand In-class contact networks • Identifying class intervals • Extracting class networks • Objective 2: generative network model that model the digital trace network • Objective 3: comparison study on the impact of detailed sublocation structure
Use Theoretic Graph Models to Fit Digital Trace Templates • G(n,p) modelis not appropriate: • Cannot: match degree, match clustering coefficients • Can: match n; match the sum of edge weights by adjusting p • Chung-Lu model: match both degrees and edge weights • List of degree kv of each node v from a digital trace template • Chung-Lu model connect each node pair (v, u) with probability where m is the total edge number • We adjust the edge weight for each generated edge, so that the edge weight follow a power law distribution. • ERGM model: • more powerful candidate • complex compared to Chung-Lu model
Compare Spectral Gaps between Digital Trace Templates and Graph Models • Spectral Gap of a network: the difference between the largest two eigenvalues of the network adjacency matrix • A larger spectral gap means the disease is easier to spread on the network.
Outline • Data sets • Objective 1: understand In-class contact networks • Identifying class intervals • Extracting class networks • Objective 2: generative network model that model the digital trace network • Objective 3: comparison study on the impact of detailed sublocation structures
School Networks and the Region Network • Aim: To compare three in-class models within a realistic context, we use the three models to construct three types of high school networks, and further embed school networks within the larger regional network • Input: • High school populations in NRV region • The NRV population in NRV regions • Output: • Three types school networks based on three in-class models respectively • Three types of NRV Network based on three in-class models respectively
Structural Properties of School Networks Embedded with Different In-class Models • The school network based on calibrated ChungLu model seems a good match to that based on digital trace templates, structurally.
Disease Spread in a Social Network • Within-host disease model: SEIR • Between-host disease model: • probabilistic transmissions along edges of social contact network • from infectious people to susceptible people
Epidemic Dynamics of School Networks Embedded with Different In-class Models Simulation to ILI without Intervention Vaccine high degree nodes Vaccine high degree nodes +social distance
Summary of the Comparison Study • The digital trace based templates capture network structures that are critical in understanding the role of interventions, and not available in previous theoretic sublocation models such as G(n,p) • It is possible to capture a faithful structural features or dynamics by tuning appropriate theoretic graph models like Chung-Lu to the real digital trace templates, at least under some limited scenarios. • ERGM could possible serve as a good model, but Chung-Lu model seems like a reasonable fit for now.
Conclusions • We show a hybrid methodology that combines subjective survey with digital trace data. • In-class contact structure is important in understanding epidemics and intervention strategies. • Our methodology is generic, applicable to other template networks • Office building • Military bases • Hospital rooms • … …
Illustration to Class Network Topology Structure • Types of classroom organization: teacher-centered or peer-based(internet source: Research Unit for Multilingualism and Cross-Cultural Communication)