Download
1 / 24
260 likes | 525 Views
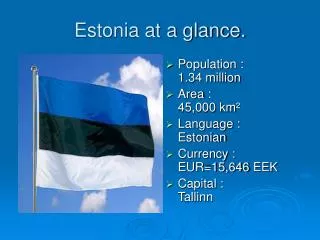
Estonia at a Glance. Population: Area: Language: Currency: GDP: GDP growth: Export :. 1.4 million 45,000 km² Estonian EUR 1 = EEK 15.65 5 465 EUR per capita (200 3 ) 5.1 % (200 3 ) 54.8 % of GDP (200 3 ). Map of Estonia. Policy Framework in Estonia. Government policies

E N D
Estonia at a Glance Population: Area: Language: Currency: GDP: GDP growth: Export: 1.4 million 45,000 km² Estonian EUR 1 = EEK 15.65 5 465 EUR per capita(2003) 5.1 % (2003) 54.8 % of GDP (2003)
Policy Framework in Estonia Government policies • stable currency and balanced state budget • liberal foreign trade • EU and NATO membership Legal framework for FDI • equal rights with local businesses • right to purchase and own land • unrestricted profit repatriation
GDP growth and inflation1995-2003 Source: Statistical Office of Estonia
1. Hong Kong 2. Singapore 5. Ireland 6. ESTONIA 7. United Kingdom 8. Denmark 10. USA 12. Sweden 15. Finland 18. Germany 23. Lithuania 28. Norway 30. Latvia 32. Czech Rep. 38. Japan 42. Hungary 57. Poland 114. Russia Index of Economic FreedomRankings 2004 Source: Wall Street JournalThe HeritageFoundation
1. Finland (1) 2. USA (2) Sweden (3) 4. Taiwan (5) 5. Denmark (4) 6. Norway (9) Japan (11) 11. UK (15) 13. Germany (13) 17. Austria (17) 20. ESTONIA (22) 27. France (26) 33. Slovenia (31) 36. Lithuania (40) 39. Hungary (33) 40. Czech Republic (39) 43. Slovak Republic (43) 44. Latvia (37) 60. Poland (45) 70. Russia (70) Growth Competitiveness Rankings 2004 Source: World Economic Forum
1. USA (1) 2. Singapore (4) 3. Canada (6) 7. Denmark (5) 8. Finland (3) 11. Sweden (12) 15. Netherlands (13) 17. Norway (15) 21. Germany (20) 22. UK (19) 23. Japan (25) 28. ESTONIA (22) 30. France (23) 30. Slovak Republic (46) 42. Hungary (34) 43. Czech Republic (35) 50. Russia (54) 57. Poland (55) World Competitiveness Ranking 2004 IMD World Competitiveness Yearbook 2004
Country Credit Ratings- Estonia Fitch IBCA A- Standard & Poor’s A- Moody´sA1
Tax System • Simplicity – few taxes, no overproduction of legal acts • Excellent IT-Systems – electronical filling of tax returns • Principle of Equal Treatment • Taxes not raised in Estonia • No net wealth taxes • No inheritance or gift tax • No business licence tax or taxes on capital of the company • No church taxes
Taxes in Estonia Unemployment insurance 0.5 (employer) 1.0 (employee) * No corporate income tax on reinvested earnings Source: EIA
Internet Connected Hosts per 10 000 Inhabitants 2003 Source: International Telecommunication Union
Mobile Phone Subscribers per 100 Inhabitants 2003 Source: International Telecommunication Union
FDI into Estonia 1997 –2004 Q I-II Source: Bank of Estonia
FDI into Estonia by Country as of 30.06.2004 Total Stock 5.9 billion EUR Source: Bank of Estonia
FDI into Estonia by Activity as of 30.06.2004 Total Stock 5.9 billion EUR Source: Bank of Estonia
The Top 20 Reciepents of FDI in CEE, 2002 and 2003 (Bln US$) Source: UNCTAD, World Investment Report 2004
FDI Stock per capita in CEE, 2003 (EUR) Source: Enterprise Estonia; National Statistics
Estonian Exports and Imports 1997 –2004 Jan-May Source: Statistical Office of Estonia, special trade method
Estonian Exports by Country, 2004 Jan-May Total: 1.83 Mln EUR Source: Statistical Office of Estonia, special trade method
Estonian Exports by Commodity Groups, 2004 Jan-May Total: 1.83 Mln EUR Source: Statistical Office of Estonia, special trade method
GDP by Sectors 2003 Source: Statistical Office of Estonia
Industry Structure 2002 Source: Statistical Office of Estonia
Pre-Accession Period: SAPARD (2000-2002: ca 13 MEUR) ISPA (ca 35 MEUR) PHARE (1992-2002: ca 223 MEUR) 271 million Euro Post-Accession Period (2004-2006) 386 MEUR: ERDF, ESF, EAGGF, FIFG 311 MEUR: Cohesion Fund 173 MEUR: CAP + rural development 69 MEUR: Schengen Facility 20 MEUR: Transition Facility 959 million Euro EU Suppport to Estonia Source: Ministry of Finance