Download
1 / 96
960 likes | 1.12k Views
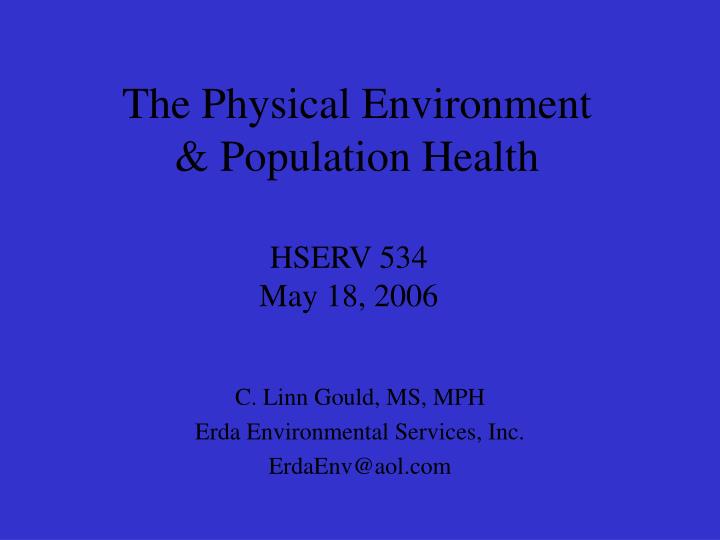
The Physical Environment & Population Health. HSERV 534 May 18, 2006. C. Linn Gould, MS, MPH Erda Environmental Services, Inc. ErdaEnv@aol.com. Agree or Disagree.

E N D
The Physical Environment & Population Health HSERV 534 May 18, 2006 C. Linn Gould, MS, MPH Erda Environmental Services, Inc. ErdaEnv@aol.com
Agree or Disagree The physical environment does not have much to do with population health compared to other factors like income inequality or poverty.
What Stephen asked me to do Is there an independent effect of the physical environment that can be demonstrated over and above the ideas of relative poverty? What is there in the science or facts that the physical environment is a critical factor?
Argument for today Environmental (in)equality is an important determinant of health
Objectives • Explore environment definition • Environmental racism/(in)justice and health • Where is the evidence? • Income inequality, the environment, and population health • Discussion
Different Definitions of Environment Everything Minus genetic Minus behavior Minus social Minus natural Physical, chemical, biological agents Adapted from Smith et al, 1999
5% Environment Actual Causes of Death our “health …is determined by factors acting not … in isolation but by our experience where domains interconnect.” 30% Genetics 40% Behavior 10% Medical 15% Social circum- stances Adapted from McGinnis et al. 2002
Environment definitions “The interplay between ecological (biological), physical (natural and built), social, political, aesthetic, and economic environments.” (IOM, 2001) The environment includes the chemical, physical, and biological agents to which we are exposed in our regular everyday surroundings, but also lifestyle choices, socioeconomic status, poverty, diet and nutrition, and behavior (NIH from: EPA, Building Healthy Environments to Eliminate Health Disparities Symposium, 2003)
Causal Pathway Between Socioeconomic Status and Health Through Environmental Risk Exposure Poverty/ SES Environment Health Quality • Environment defined as: • Ambient and indoor air • Water quality • Noise • Residential crowding • Housing • Education • Work • Neighborhood conditions Evans & Kantrowitz, 2002
What is environmental (in)justice (EJ)?Can you give some examples?
“Toxic Terrorism” Toxic residues exported from developed countries to developing countries OR to our own people (garbage, mercury, pesticides, etc)
Nigeria Niger River Delta Oil discovered 1958
Contamination from Explosion Flares - 28 million cubic meters per day Oil contaminated water
Polluted Swamps On Niger Delta
Ken Saro-Wiwa Ogoni people deprived of economic prosperity of own lands Poverty one of highest in Nigeria. No electricity, piped water, health care, schools limited Sick people from oil contamination. Life expectancy drops to 6 years less than national average. Structural adjustment – oil produces $20 billion annually Hung for protesting against Shell
Global Climate Change and Population Health • Increased heat related morbidity and mortality • More frequent and intensified weather disasters (Hurricane Katrina) • Increases in geographic range and incidence of vector borne diseases • Climactically related production of photochemical air pollutants, pollens, and spores • Environmental refugees? Tong el al, 2002
What Duwamish would look like if not filled in
EJ vs. Mainstream Environmental Movement - social agenda • Social determinants of health orientation – exposure to pollution is rooted in disparities caused by societal structure • Social justice demands – clean jobs, sustainable economy, safe and affordable housing, racial justice (Cole & Foster, 2001) Cherry Cayabyab, LELO
EJ Movement Recognition – Social factors increases susceptibility to disease • Poor nutrition • Socioeconomic stress • Insufficient access to health care • Lack of affordable and/or safe housing • Lack of community cohesion • Limited control at work • Co-exposure to other pollutants
EJ environment defined differently: • Includes home, workplace, community in addition to toxic assaults • “A community’s perception is its reality”(Bullard, 1994) • Health impacts can be psychosocial – If water/air perceived to be contaminated, lifestyle is affected (Edelstein, 2002)
Pyschosocial Impacts on Health • Noise, odors, traffic, etc • Loss of control of physical and social environment • Distrust and stress if no participation in decision making • If environment perceived to be contaminated, life style behavior changes (bathing, gardening, cooking, diet, cleaning) Edelstein, 2002
EJ movement redefines environmentalism “It basically says that the environment is everything: where we live, work, play, go to school, as well as the physical and natural world. And so we can’t separate the physical environment from the culturalenvironment.” Robert Bullard, 1999
Political, Economic, Social, and Cultural/Spiritual Context to EJ Stress Crime Activities (work, play, church, cultural practices, etc.) Housing (affordable, safe, etc) Transportation Health care access Sustainable economy Individual factors (diet, smoking, alcohol, genetics) Natural world (green space) Contamination (air, water, food, soils, etc)
Where is the evidence??????? ? Environmental hazards Pollution exposure (air, water, soil) Adverse health effect (low cumulative doses) Gould, 2005
Environmental hazards Pollution Exposure (air, water, soil) The Evidence: US GAO, 1983: African Americans make up majority of population where landfills are located. United Church of Christ, 1987: Minority and low income communities are afflicted with disproportionate amount of country’s pollution. EPA, 1992: same as above National Law Journal, 1992: Unequal enforcement in minority communities across nation - “Proof” that least power receives inadequate protection. Lopez, 2002: Increased segregation associated with increased disparity in potential exposure to air pollution Morello-Frosch et al, 2002: Communities of color bear a disproportionate burden in location of treatment, storage, and disposal facilities and Toxic Release Inventory Facilities AND MANY MANY MORE Gould, 2005
Where is the evidence? ? Pollution Exposure (industrial facilities, transportation corridors) Adverse health effect (premature death, chronic disease) Burden of proof placed on the exposed. Why hasn’t the research been done? Institutional discrimination? Classist?
Lack of evidence – racist? “Those scholars who attempt to isolate economics from racism as causal factors in explaining environmental inequity are missing the point. In fact, such efforts to tease out, for analytical purposes, the effects of these discrete variables on pollution impacts can itself be seen as a form of racism”(Clarke and Gerlak, 1998)
The evidence: plethora of conceptual models being introduced Poverty/ SES Physical Environment Health Quality Evans & Kantrowitz, 2002
Analytic Framework: Geographies of Susceptibility, Exposure, and Risk Geography of Exposure Geography of Risk Geography of Susceptibility Jerrett & Finkelstein, 2005
“Double Jeopardy” High frequency and magnitude of multiple contaminant exposure Psycho-social Stressors: Poverty, Material deprivation, Lack of services Health Disparities (Birth outcomes) + = Morello-Frosch & Shenassa, 2006
Potential Pathways for Socioeconomic Position to Increase Susceptibility and Exposure Socioeconomic position Race/ethnicity/sex Differential exposures Work: low-wage job, occupational exposures Neighborhoods: outdoor pollutants Housing: crowding, allergens, indoor pollutants Differential vulnerability -Existing medical conditions -Genetic susceptibility -Access to health care -Access to fresh foods -Violence/stress Unequal health outcomes O’Neill et al, 2003
Air Pollution Asthma • Natural disasters such as “London Fog” – thousands of deaths in 1952 • Particulates in smoke associated with and pulmonary morbidity and CHD • 1996 Atlanta Olympic games – no cars allowed in city – 42% reduction in asthma claims reported to Medicaid Brown et al, 2003
Air Pollution Asthma • Increases of 74% between 1980 and 1996 in US. • 14.6 million suffering from asthma in 1996 with cost at $11 billion/yr • Blacks and poor 15-20% more likely to have asthma • Causes: Indoor and outdoor air pollution Brown et al, 2003
The Evidence:Social ecology and child vulnerability to environmental pollutants(Weiss & Bellinger, 2006) • Exposure to neurotoxic chemicals in early life, even prenatal environment creates permanent changes in brain structure and chemistry and behavior • Early social environment variables (neighborhood and community characteristics) need to be accounted for – SES is not enough • Traditional approaches need to be revised.
The Evidence:Pre-term births: social environment and physical environment interactions(Ponce et al 2006) • Adverse social environment (concentrated poverty, unemployment, dependence on public assistance) • Adverse physical environment (winter thermal inversions trapping traffic related air pollutants) • Pre-term births higher in low SES neighborhoods
Brownfields in Baltimore, Maryland (Litt et al, 2002) Brownfields Excess mortality A Former Metal Stamping Plant The rail industry
Population Characteristics Percent Minority *by Census Block Group Percent Below Poverty Home-Owner Occupancy 0 - 19 percent 0 - 19 percent 0 - 22 percent 20 -50 percent 20 -39 percent 23 - 44 percent 51 - 82 percent 40 - 59 percent 45 - 64 percent 83 - 100 percent 60 percent and higher 65 - 88 percent Source: Litt et al,, Environ Health Perspect 110(suppl2):183-193 (2002)
Population Characteristics Less than High School Degree Working Class 2 - 17 percent 21 - 46 percent 18 - 24 percent 47 - 66 percent 25 - 44 percent 66 - 75 percent 45 - 73 percent 75 percent or higher Source: Litt et al,, Environ Health Perspect 110(suppl2):183-193 (2002)
Mortality Patterns for Leading Causes of Death: Age-Adjusted Mortality Rates Heart Disease Cancer Stroke Lowest Rates Lowest Rates Lowest Rates Highest Rates Highest Rates Highest Rates Source: Litt et al,, Environ Health Perspect 110(suppl2):183-193 (2002)
Mortality Patterns for Leading Causes of Death: Age-Adjusted Mortality Rates (Litt et al, 2002) COPD Lung Lowest Rates Lowest Rates Highest Rates Highest Rates
Methods: Statistical Analysis Response Variables: Mortality: - Leading Cause of Death Index - Heart Disease - Cancer - Stroke - Influenza -Pneumonia - Diabetes - COPD - Liver Disease Independent Variables: - Brownfields Score - Age (categorical) - Area of census tract - Principal Component 1: Poverty status, Percent Minority and Home- Owner Occupancy - Principal Component 2: Working Class, Educational Attainment Cancer Incidence: - Respiratory System - Digestive System - Brain and Other Nervous System - Multiple Myelomas - Leukemias - Lymphomas Log (Expected Deaths) = 0 + 1(Brownfields Score) + 2 (Age) + 3 (Area of Census Tract) + 4 (PC1) + 5 (PC2) Source: Litt et al,, Environ Health Perspect 110(suppl2):183-193 (2002)
United States Maryland Rest of City Southeast Baltimore Comparing Baltimore’s Mortality to Maryland and U.S. Rates • Findings: Excess mortality in Zone 3 compared to Zone 1 was observed when adjusted for socioeconomic position, age, and area of census tract. Age-Adjusted Rates per 100,000 Source: Litt et al,, Environ Health Perspect 110(suppl2):183-193 (2002)
Causal Pathway from Income Inequality to Population Health through Environment Income Inequality Environmental Quality Indicator: Morbidity? Mortality? Power? Well being? Gould, 2003
Environmental Paglin-Gini (EPG) • If air and water emissions unequally distributed across locations, no equity unless individuals/states appropriately compensated. • EPG is calculated 1988-1996 for states and then grouped by amount of per capita manufacturing. • EPG higher in high manufacturing areas but has improved with time • Overall inequality is rising Millimet & Slottje, 2002
Environmental Kuznets Curve Environmental degradation Environmental quality initially worsens but ultimately improves with income Per capita income
Redrawn Environmental Kuznets Curve Environmental degradation Environmental quality initially worsens, then improves, but then worsens due to increasing income inequality = increasing power inequality?? (Torras & Boyce, 1998) Per capita income Gould, 2005