Download
1 / 8
80 likes | 238 Views
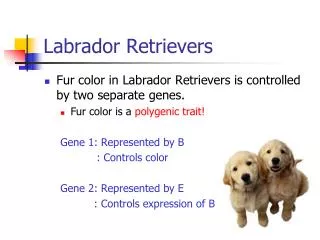
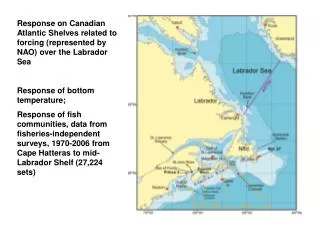
This study explores the relationship between the North Atlantic Oscillation (NAO) and fish communities in the Canadian Atlantic Shelves, specifically over the Labrador Sea. Analyzing fisheries-independent data from 1970-2006, we assess responses of bottom temperatures and species diversity under varying NAO conditions, illustrating shifts during mild vs. severe winters. The findings emphasize how climate forcing influences fish community dynamics and suggest that species respond rapidly to thermal changes, affecting diversity gradients and ecological resilience.

E N D
Response on Canadian Atlantic Shelves related to forcing (represented by NAO) over the Labrador Sea Response of bottom temperature; Response of fish communities, data from fisheries-independent surveys, 1970-2006 from Cape Hatteras to mid-Labrador Shelf (27,224 sets)
Central Labrador Sea Sta. 27 Nfld (dot) Emerald Basin, SS (triangle) Prince 5, Bay of Fundy (square) (a) 1 year; (b) 3 run y
Unnormalized Annual Mean Temperature differences of Negative NAO (mild winters) run* years – Positive NAO (severe winters) run years *years with at least 2 previous years with the NAO having the same sign,shown as large dots below. NAO time series
Individual Species Response: 2 examples of mobile species Severe winters over Lab-Nfld Shelf Mild winters over Lab-Nfld Shelf
Severe winters over Lab-Nfld Shelf Mild winters over Lab-Nfld Shelf
Fish Community Response: all observed species Annual average bottom temperature and Cumulative Species Diversity versus latitude from 35oN (Cape Hatteras) to 55oN (Mid-Labrador Shelf). Long term there is a strong relationship between number of species and bottom temperature Cumulative Species Diversity Latitude
Temporal Variability If fish can respond quickly to T changes then: Positive NAO years: severe winters over Lab Sea; colder than normal btm shelf T and fewer species in north, warmer with more species in south; steeper (more negative) latitudinal diversity gradient. Negative NAO years: mild winters over Lab Sea; warmer than normal btm shelf T and more species in north, colder with fewer species in south; shallower latitudinal diversity gradient.
Observed response using all years: Qualitatively fits with expectations (LDG range corresponds to 42 species; Rapid fish community response to T variations; Affects fish community dynamics through top predator replacement (another species ready to assume role), resiliency (ability to return to earlier state; to cope with higher exploitation levels).