Download

1 / 20
200 likes | 315 Views
Tropospheric response to Solar and Volcanic forcing. Joanna Haigh, Mike Blackburn and Rebecca Day. Outline. Climate change context Observed solar variability Amplification of the solar signal – stratospheric O 3 Regressed variations in tropospheric climate

E N D
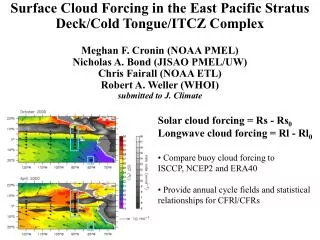
Tropospheric response to Solar and Volcanic forcing Joanna Haigh, Mike Blackburn and Rebecca Day
Outline • Climate change context • Observed solar variability • Amplification of the solar signal – stratospheric O3 • Regressed variations in tropospheric climate • Modelled response to stratospheric heating (IGCM)
Natural causes of climate change Explosive volcanoes Solar activity
Observations of total solar irradiance >2 solar cycles Absolute values uncertain ~0.08% (1.1Wm-2) variation C. Frölich, PWDOC http://www.pmodwrc.ch/
Reconstruction using solar indices Extrapolate an index which correlates with TSI over the observed period Several indices! IPCC: change in radiative forcing since 1750: 0.3 0.2Wm-2 Conversion TSI to RF: 4 disc-area 0.7 albedo Sunspot number (grey); Amplitude of sunspot cycle (red); Length of sunspot cycle (black); aa geomagnetic index (green) IPCC TAR http://www.grida.no/
Amplification of Solar Forcing • Solar UV and impact on stratospheric O3 (Haigh 1994) • - solar cycle variation ~7% at 200nm (cf 0.08% in TSI) • absorption by O3 stratospheric heating • downward IR flux into troposphere • dynamical impacts on troposphere • changes in O3 • Modulation of low-level cloud • cover (Svensmark & Friis- • Christensen 1997) • - assumed mechanism involving • galactic cosmic rays
Dynamical Correlations • 30hPa geopotential height (Labitzke & van Loon, 1997) • - 4 solar cycles, 10.7cm solar radio-flux • 200hPa subtropical temperature (Haigh, 2003) • - 1979-2000 multiple regression
35°N T (200hPa) regressions • Multiple regression of zonal mean T (200hPa) • NCEP-NCAR reanalysis • - solar variability (red) • volcanic aerosol (green) • QBO (cyan) • NAO (blue) • ENSO (black) • trend (straight black line) • amplitude/phase of annual & semi-annual cycles 35°S 35°S T at 35°S Haigh (2003)
NCEP-NCAR reanalysis 1979-2000 shading: <95% significance Temperature regressions trend ENSO Volc solar NAO QBO Haigh (2003)
QBO [u] volcanic trend ENSO solar NAO NCEP-NCAR reanalysis, 1979-2002 Zonal wind regressions 95% significance: u ~ 0.5 ms-1
Regressed extremes of zonal wind solar min solar max Jets weaken, shift poleward low aerosol PinaTubo Jets weaken, shift eq’ward
GCM response to stratospheric UV, O3 [T] regression: NCEP-NCAR reanalyses GCM response: HadAM3 L58 smaller amplitude Larkin et al (2000)
Idealised GCM experiments IGCM, Held-Suarez forcing: Newtonian heating; Rayleigh friction (PBL) Modify reference state in lower stratosphere Reference state [ T ] Climate average [ T ]
Zonal wind [ u ] MMC [ Ψ ] Heat flux [ v’T’ ] Momentum flux [ u’v’ ] Control climate
Stratospheric heating experiments U5 Experiments: Increase stratospheric reference [ T ] E5 : 5K * cos2φ U5 : 5K P10 : 10K * sin2φ Effect is to lower and tilt reference tropopause E5 P10
Response to stratospheric heating [T] [u] U5 E5 P10
“volcanic” eddy flux response : U5–C [u] [T] [u’v’] [v’T’]
“solar” eddy flux response : E5 – C [u] [T] [u’v’] [v’T’]
Conclusions • Modelled responses agree with analysis regressions • Suggests that dynamical eddy feedbacks dominate over moist feedbacks in troposphere • Future work • Causality chain from ensemble spin-up experiments • Zonally symmetric model to separate eddy feedbacks from zonally symmetric processes