Air Quality Applied Sciences Team (AQAST)
160 likes | 286 Views
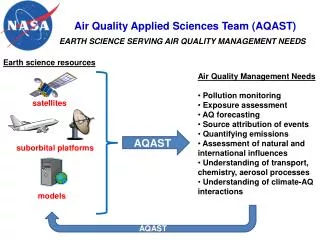
Air Quality Applied Sciences Team (AQAST). EARTH SCIENCE SERVING AIR QUALITY MANAGEMENT NEEDS. Earth science resources. Air Quality Management Needs Pollution monitoring Exposure assessment AQ forecasting Source attribution of events Quantifying emissions

Air Quality Applied Sciences Team (AQAST)
E N D
Presentation Transcript
Air Quality Applied Sciences Team (AQAST) EARTH SCIENCE SERVING AIR QUALITY MANAGEMENT NEEDS Earth science resources • Air Quality Management Needs • Pollution monitoring • Exposure assessment • AQ forecasting • Source attribution of events • Quantifying emissions • Assessment of natural and international influences • Understanding of transport, chemistry, aerosol processes • Understanding of climate-AQ interactions satellites AQAST suborbital platforms models AQAST
Daniel Jacob (leader), Loretta Mickley (Harvard) • Greg Carmichael (U. Iowa) • Dan Cohan (Rice U.) • Russ Dickerson (U. Maryland) • Bryan Duncan, Yasuko Yoshida, Melanie Follette-Cook (NASA/GSFC); Jennifer Olson (NASA/LaRC) • David Edwards (NCAR) • Arlene Fiore (Columbia); Meiyun Lin (Princeton) • Jack Fishman, Ben de Foy (Saint Louis U.) • DavenHenze, Jana Milford (U. Colorado) • Tracey Holloway, Steve Ackerman (U. Wisconsin); Bart Sponseller (Wisconsin DRC) • Edward Hyer, Jeff Reid, Doug Westphal, Kim Richardson (NRL) • Pius Lee, TianfengChai(NOAA/NESDIS) • Yang Liu, Matthew Strickland (Emory U.), Bin Yu (UC Berkeley) • Richard McNider, ArastooBiazar (U. Alabama – Huntsville) • Brad Pierce (NOAA/NESDIS) • Ted Russell, YongtaoHu, TalatOdman (Georgia Tech); Lorraine Remer (NASA/GSFC) • David Streets (Argonne) • Jim Szykman (EPA/ORD/NERL) • Anne Thompson, William Ryan, SuellenHaupt (Penn State U.) AQAST Membership: PIs and Co-Is
AQAST organization • AQAST supports two types of projects: • Investigator Projects (IPs). These involve typically a single AQAST member working with an air quality management partner; • Tiger Team Projects (TTPs). These involve a collaboration of several AQAST members pooling their expertise to address urgent needs from one or more air quality management partners. • AQAST projects must bridge Earth Science and air quality management: • Focus on use of Earth Science resources • Clear air quality management outcomes • 1-year deliverables of value for air quality agencies • AQAST has great flexibility in how it allocates its resources • Members are encouraged to adjust their IPs to the evolving needs of air quality management • The TTPs are redefined yearly to address the most pressing needs • The team is self-organizing and can respond quickly to demands Help us help you! Contact Daniel Jacob (djacob@fas.harvard.edu) to discuss how AQAST can help address your specific AQ management needs
Partner agency SIP Modeling AQ processes Monitoring AQ-Climate Background IC/BC for AQ models Forecasting Emissions Future satellites • Local: RAQC, BAAQD • State: TCEQ, MDE, • Wisconsin DNR, CARB, • Iowa DNR, GAEPD, GFC • Interstate: EPA Region 8, • LADCO • National: NPS, NOAA, • EPA Scope of current AQAST projects (IPs and TTPs) Theme Satellites: MODIS, MISR, MOPITT, AIRS, OMI, TES, GOES Suborbital: ARCTAS, DISCOVER-AQ, ozonesondes, PANDORA Models: MOZART, CAM AM-3, GEOS-Chem, RAQMS, STEM, GISS, IPCC Earth Science resource
AQAST bimonthly newsletter subscribe through web site or send me email AQAST website: http://acmg.seas.harvard.edu/aqast Email: djacob@fas.harvard.edu
GEOS-Chem model simulation of background ozone over the USin support of the current ozone ISA and REA Color scale Indicates topography (surface pressure) • 0.5o x0.67oresolution for North America, 2o x2.5o global, 48 vertical layers • Driven by NASA GEOS-5 assimilated meteorological data • Detailed mechanistic representation of ozone-NOx-VOC-aerosol chemistry • 2006 anthropogenic emissions: NEI05 for US, CAC for Canada, BRAVO (scaled) for Mexico, EMEP for Europe, Streets for East Asia, EDGAR (scaled) for rest of world • Natural sources: lightning (OTD/LIS), fires (GFED2 monthly), soils (Yienger), stratosphere (Linoz) • 2006-2008 3-year simulation; focus on 2006 for evaluation 0.5x0.667 2x2.5 Zhang et al. [2011] – http://acmg.seas.harvard.edu/publications/zhang2011.pdf
Standard – as described above US background – no US anthro emissions NA background - no N.Americananthro emissions Natural – no anthro emissions worldwide 2006 MDA8 ozone at CASTNet sites- with mean (4th highest) inset Four GEOS-Chemsimulations US background: see Wang et al. [2009] http://acmg.seas.harvard.edu/publications/wangh2009_ozone.pdf
Ozone statistics for the US (CASTNet sites) Natural: 18 ± 6 PRB: 27 ± 8 Model: 52 ± 12 Obs: 50 ± 13 + > 1.5 km Frequency distribution of MDA8 ozone for March-August 2006 27 ± 6 • GEOS-Chem is overall unbiased • PRB is 4 ppb higher than in previous GEOS-Chem versions • Model shows little interannual variability for 2006-2008, neither do observations 40 ± 7 57 ± 10 58 ± 9 Zhang et al. [2011]
Model “4th highest” MDA8 ozone in 2006 Annual 4th highest ozone 4th highest PRB value PRB for annual 4th highest ozone Background may limit or confuse ability of West to achieve a 60 ppb NAAQS; no such issue in East Zhang et al. [2011]
Model PRB statistics vs. observed ozone in Intermountain West Comparison of daily MDA8 ozone concentrations for the ensemble of elevated sites (>1.5 km; 11 sites) in Intermountain West for spring and summer 2006 1:1 line max r = 0.57 r = 0.33 75th 50th 25th min • Model underestimates high extrema in spring (> 75 ppbv) - stratosphere • Correlation with measurements is poor in summer – lightning, wildfires Lin Zhang, Harvard
Model underestimate of stratospheric intrusions in spring Sample stratospheric intrusion at Pinedale (WY) : model captures timing but not magnitude. Obs. model observations PRB stratosphere Observed vs. simulated MDA8 ozone in spring 2006 at the 11 elevated CASTNetsites, colored by model stratospheric ozone concentration. Model has correct STE and vertical transport; we attribute problem to the general difficulty of Eulerian models in resolving fine structures. Lin Zhang, Harvard
Ozone enhancement from lightning in Intermountain West model observations PRB lightning • Model lightning increases ozone concentrations by 7-19 ppbv in summer, comparable to enhancements from US anthropogenic emissions. • This lightning influence in the model is biased high, even though lightning location is constrained by OTD/LIS satellite observations; • focus future model improvement on NOx yield per lightning flash, vertical distribution Lin Zhang, Harvard
Maximum fire enhancements of MDA8 ozone In GEOS-Chem – August 2006 Sensitivity of model ozoneto wildfire emission inventory • Model is highly sensitive to choice of inventory, spatial and temporal resolution • Influence of fires is mainly limited to fire region; little influence at CASTNet sites in 2006 • Need to examine other years, MOPITT and AIRS CO data for fires fire reports monthly Lin Zhang, Harvard
Effect of bromine chemistry on the ozone background • Bromine sources in troposphere from marine bromocarbons (especially bromoform, CHBr3 ) and sea-salt debromination • Bromine chemistry drives catalytic ozone loss and NOx loss GEOS-Chem mean ozone decreases (ppb) from bromine chemistry Background surface ozone in US decreases by 3 ppb (annual mean) Justin Parrella, Harvard
Effect of HO2 conversion to H2O in aerosols • Atmospheric observations suggest a large loss of HO2 to aerosols missing from current models. • Coupled Cu-Fe transition metal redox chemistry could drive such an uptake and convert HO2 to H2O GEOS-Chem mean surface ozone decrease (ppb) from HO2 H2O chemistry Background surface ozone in US decreases by 2-5 ppb (annual mean) Jingqiu Mao, submitted
Question from Adele Malone: “where should we be making measurements (nationally; regionally) and what other parameters should we be measuring?” • Spring-summer measurements at remote sites and over a range of altitudes provide the best tests of model background ozone • ozone at remote sites can often approximate background • background increases with altitude • plateau better than mountaintop • Concurrent CO measurements with 10 ppb sensitivity can greatly help for source attribution of background ozone • CO very high (fires), high (urban), low (lightning), very low (stratosphere) • Have money to spare? Invest in an ozone lidar • continuous measurement of ozone vertical distribution • Get into NASA (and NOAA)’s deep pockets with research-to-operations motivation • Geostationary satellite for ozone vertical distribution (GEO-CAPE) • Aircraft campaigns, ozonesondes • AQAST is your advocate! Spread the word that AQAST is an important resource for AQ management McDonald-Buller et al., Establishing Policy Relevant Background (PRB) Ozone Concentrations in the United States, Environ. Sci. Technol., 2011 http://acmg.seas.harvard.edu/publications/mcdonaldbuller2011.pdf