Download
1 / 11
110 likes | 134 Views
Investigating the mechanisms of muscle regeneration and differentiation in C2C12 cells and mouse skeletal muscle post-injury through gene expression and cell proliferation analyses. Utilizing immunostaining, Western blot, and mRNA expression to explore the roles of key proteins and miRNAs.

E N D
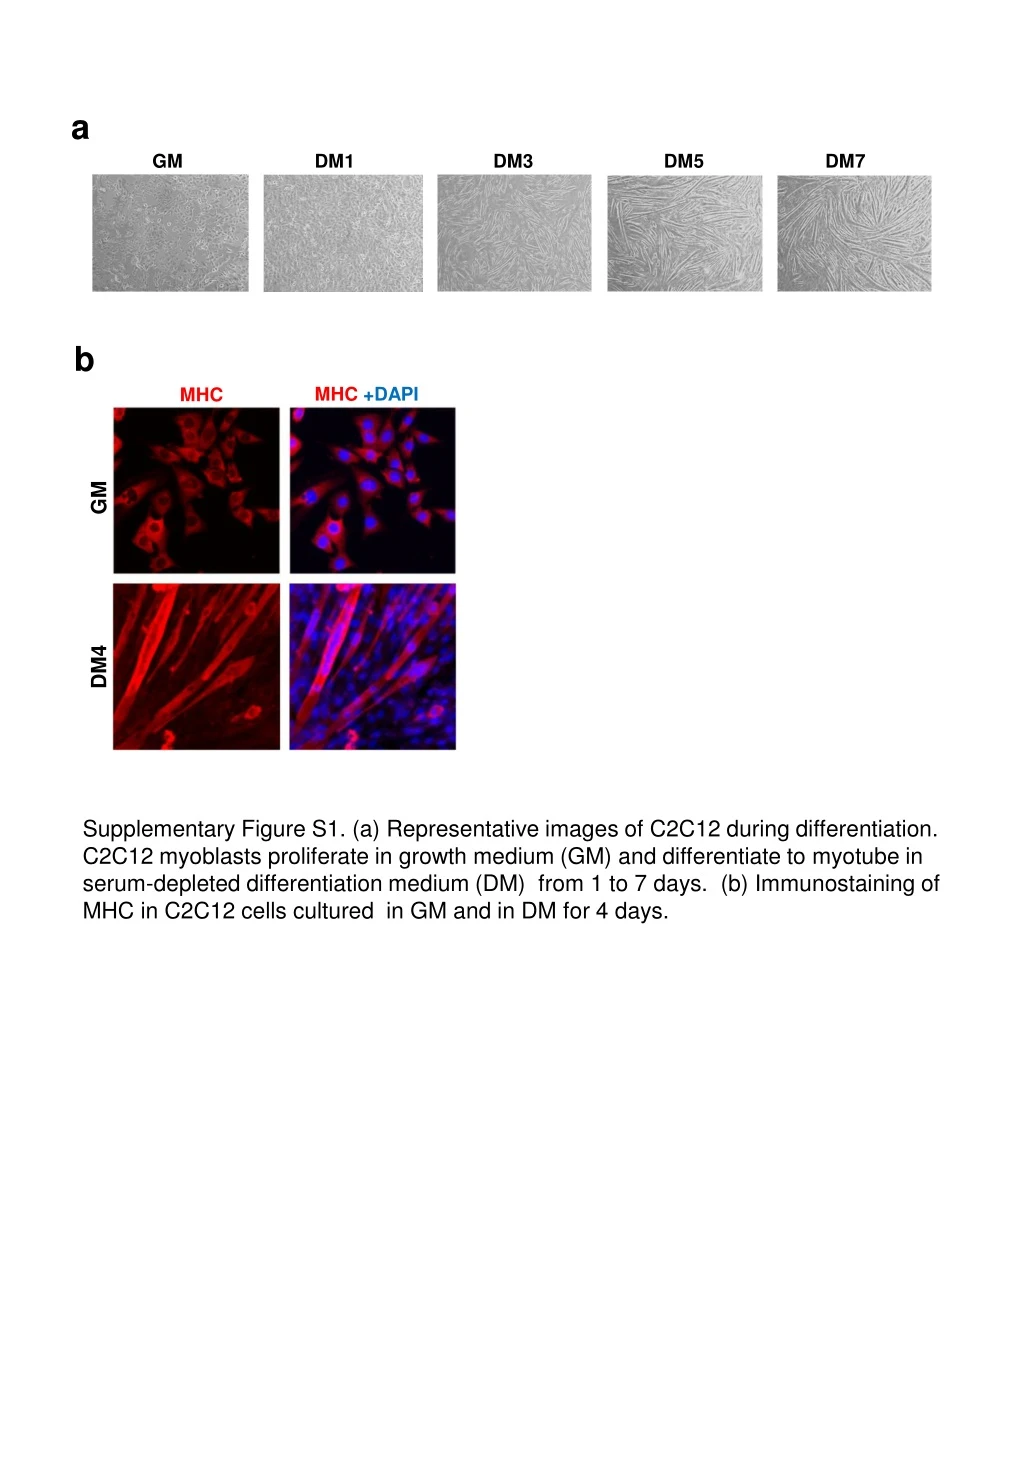
a GM DM1 DM3 DM5 DM7 b MHC +DAPI MHC GM DM4 Supplementary Figure S1. (a) Representative images of C2C12 during differentiation. C2C12 myoblasts proliferate in growth medium (GM) and differentiate to myotube in serum-depleted differentiation medium (DM) from 1 to 7 days. (b) Immunostaining of MHC in C2C12 cells cultured in GM and in DM for 4 days.
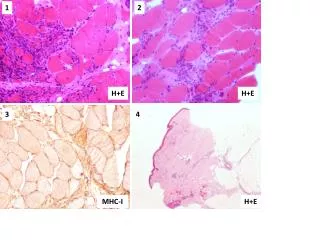
Day 0 Day 1 Day 3 Day 5 Day 10 Supplementary Figure S2. H & E images of tibialis anterior muscle cross sections in mice on days 0, 1, 3, 5 and 10 post-CTX injury. Evolution of the morphological changes were seen in the diaphragm of C57BL/6 mice with muscle regeneration, leading to accumulation of mononucleated cells and their differentiation to form new myofibers to repair damaged muscle. Arrows indicate the regenerating myofiber (Day 5).
a b Day 0 Day 1 Day 3 Day 5 Day 10 Day 0 Day 1 Day 3 Day 5 Day 10 Supplementary Figure S3. Expression of Pax7 (a)and MyoD(b) mRNAs in tibialis anterior muscles of C57BL/6 mice on days 0, 1, 3, 5 and 10 post-CTX injury. The error bars depict the mean ± standard deviations of the samples from six mice in each group.
a EdU DAPI Merge miR-NC miR-17 miR-20a miR-92a b EdU DAPI Merge dTuD-NC dTuD-17 dTuD-20a dTuD-92a Supplementary Figure S4. The cell proliferation analysis was performed by EdU incorporation of C2C12 myoblasts infected with lentiviruses expressing miR-17, -20a or -92a (a) and miRNA inhibitors dTuDs targeting miR-17, -20a, or -92a (dTuD-17, -20a or -92a) or dTuD-NC (b).
a α-sarcomeric actin α-sarcomeric actin+DAPI DAPI b C miR-mix miR-NC kDa myogenin 35 55 β-tubulin Supplementary Figure S5. (a) Immunostaining of α-sarcomeric actin in mouse primary myoblasts in GM. (b) Western blot and (c) quantification of myogenin in the primary myoblasts transfected with a mixture of miRNA mimics (miR-17, -20a and -92a) or NC and transferred to DM for four days. Beta-tubulin served as the loading control.
a C2C12 myogenesis Relative expression (/GM) b Skeletal muscle regeneration Relative expression (/Day 0) Supplementary Figure S6. (a) Expression of ENH1 protein and mRNAs (miR-17, -20a and -92a) during C2C12 myogenesis. The error bars depict the mean ± standard deviations of three independent cell samples. (b) Expression of ENH1 protein and mRNAs (miR-17, -20a and -92a) during mouse skeletal muscle regeneration after CTX-injury. The error bars depict the mean ± standard deviations of three independent cell samples. The error bars depict the means ± standard deviations of the samples with six pigs in each group.
EdU DAPI Merge si-NC si-ENH1 OE-NC OE-ENH1 Supplementary Figure S7. The cell proliferation analysis was performed by EdU incorporation of C2C12 myoblasts transfected by si-ENH1 or plasmids expressing ENH1.
Supplementary Figure S8. Expression of Id1, Id2, Id3 and Id4 mRNAs in myoblasts. The error bars depict the mean ± standard deviations of three independent cell samples. GAPDHused as the mRNA endogenous control.
a C2C12 myogenesis Protein expression b Day 0 Day1 Day3 Day5 Day10 kDa M1 M2 M1 M2 M1 M2 M1 M2 M1 M2 Id1 15 55 Tubulin c Skeletal muscle regeneration Protein expression Supplementary Figure S9. (a) Protein expression of ENH1 and Id1 during C2C12 myogenesis. The error bars depict the mean ± standard deviations of three independent cell samples. (b) Western blot analysis of Id1 protein expression during skeletal muscle regeneration after CTX-injury. M1 and M2, mouse 1 and mouse 2. (c) Protein expression of ENH1 and Id1 during skeletal muscle regeneration. The error bars depict the means ± standard deviations of the samples with six mice.
Ad-miR-NC Ad-miR-20a Day 0 Day 1 Day 3 Supplementary Figure S10. H & E images of the tibialis anterior muscle cross sections of mice injected with Ad-miR-NC or Ad-miR-20a on 0, 1 and 3 days post-CTX injury. Scale bar, 200 μm.
Supplementary Figure S11. miR-17-92 promoter luciferase assays. C2C12 myoblasts were co-transfected with the vectors expressing E2F1 and the miR-17-92 promoter luciferase reporter containing E2F binding sites (Wt) or mutant E2F sites (Mut). The error bars depict the means ± standard deviations of three measurements. ***P < 0.001.