Download
1 / 69
690 likes | 723 Views
Delve into the dynamics of pressure gradients, Coriolis effect, and friction to comprehend the creation of wind patterns. Explore the influence of geostrophic winds, high and low-pressure systems, and general circulation on global weather.

E N D
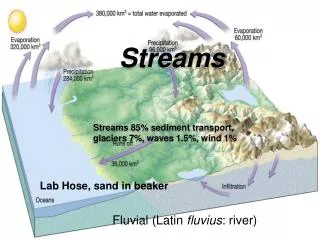
FORCES that create WIND: Surface Winds: 1. Pressure gradient 2. Coriolis effect 3. Friction Winds Aloft: (top of troposphere) 1. Pressure gradient 2. Coriolis effect
1. Pressure Gradient Horizontal (wind) Pressure Gradient Force (PGF) 1005 1000 995 990 985 PGF is perpendicular to isobars.
high wind speed. low wind speed. Wind speed determined by steepness of gradient.
Current weather map • Current wind map
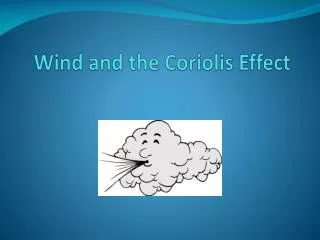
2. Coriolis Effect / Force Apparent deflection of moving object due to rotation of earth. The movement of air masses (from High pressure to Low pressure) occurs with respect to a rotating surface.
Animation • Animation • Animation • Animation
Deflection… 1. Is to the right of the path of motion in the northern hemisphere and to the left of the path of motion in the southern hemisphere. 2. Increases with latitude: maximum at poles; zero at equator Plane of deflecting force is parallel to earth’s surface at poles; no component of deflection parallel to surface at equator.
Deflection... 3. Increases with wind speed. 4. Increases with mass of object.
CE is perpendicular to path of motion. If PG and CE were only forces on atmosphere, wind would blow parallel to isobars. 997 998 999 1000
3. Friction • Surface provides friction to atmospheric movement; “slows down” the air.
Friction and Surface Winds Drag produced by surface. Frictional force is applied opposite to direction of air motion; causes wind to blow across the isobars.
Surface Winds • Northern Hemisphere: CLOCKWISE OUT of a HIGH COUNTER-CLOCKWISE IN to a LOW
Surface Winds • Southern Hemisphere: COUNTER-CLOCKWISE OUT of a HIGH CLOCKWISE IN to a LOW
Current weather • Current satellite IR
Minimal friction aloft > 3000 ft in troposphere “friction layer” : 0 – 3000 ft Winds aloft blow parallel to isobars: geostrophic wind
At surface, friction reduces wind speed, which reduces Coriolis effect. Coriolis can not balance PGF so wind crosses isobars.
geostrophic balance “balance between pressure gradient and Coriolis forces acting on a parcel so that the forces are equal in magnitude but in opposite directions”
ALOFT: GEOSTROPHIC WIND: No spiraling IN and OUT Northern Hemisphere L H Around and clockwise Around and counterclockwise Southern Hemisphere L H Around and clockwise Around and counterclockwise
The 3 dimensional view of surface Highs and Lows: Therefore, LOW pressure promotes UPLIFT, which causes clouds, etc/
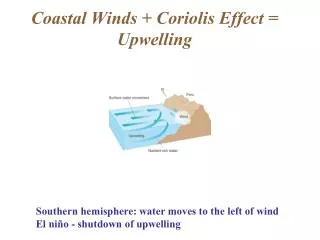
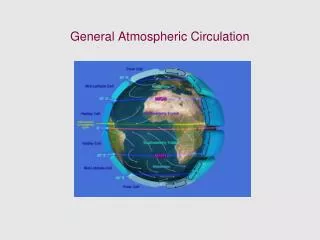
Hadley Cells At top of troposphere, spreads poleward, sinks at Subtropical Highs Warm air rising at Intertropical Convergence Zone (ITCZ) Blows towards ITCZ at Surface, creating NE and SE Trade Winds
ITCZ moves Seasonally and Hadley cells move with it.
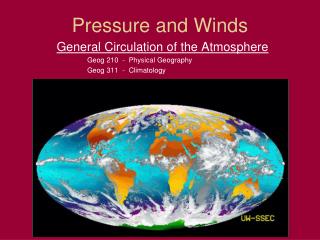
Semipermanent Pressure Cells , p. 225 Canadian High Siberian High Icelandic Low Aleutian Low Azores Bermuda High Pacific High
Pacific High Azores Bermuda High Monsoonal Low
500 625 Isobaric surfaces 750 875 1000 City City COOL HEAT
DECREASED DENSITY INCREASED DENSITY Ittakes a shorter column of cold air to exert the same surface pressure as a tall column of warm air. 500 625 500 625 750 750 875 875 1000 1000 HEAT COOL
DECREASED DENSITY INCREASED DENSITY 500 2300 meters elevation of 500 mb layer 625 500 1100 meters elevation of 500 mb layer 625 750 750 875 875 1000 1000 HEAT COOL We could map the elevation of a certain (constant) pressure.
Constant pressure map shows elevation of a given pressure. Low heights and troughs represent cold air. High heights and ridges represent warm air.
5400 5520 5580 5640 5700
Currently: • Current surface temperature map • Current map of heights of 500 mb layer
Constant Altitude Map • Shows pressure at a given altitude
Constant Altitude Map: shows pressure of a given elevation/altitude 500 625 500 1000 meters 685 520 625 750 750 875 875 1000 1000 HEAT COOL
On a constant altitude map: low pressures indicate Cold Air high pressures indicate Warm Air