Download
1 / 9
90 likes | 106 Views
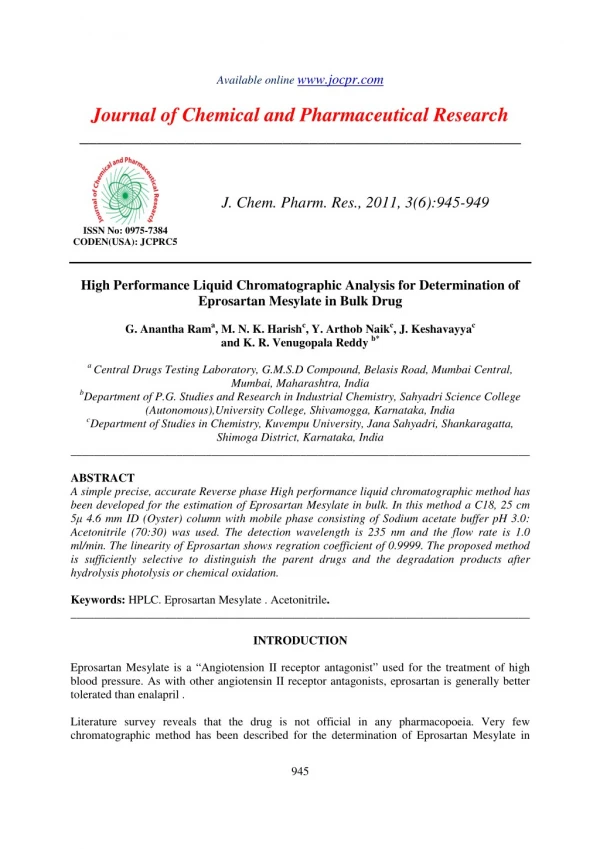
Stability-indicating high performance liquid chromatographic determination of rivastigmine in its binary mixture with kinetic study of rivastigmine alkaline degradation Stability-indicative determination of rivastigmine hydrogen tartarate (RIV) in the presence of its degradate was investigated. The degradation product was isolated, via alkaline-degradation, characterized and confirmed. Selective quantification of RIV in bulk form, pharmaceutical formulations and/or in the presence of RIV degradate was demonstrated. The analytical technique adopted for quantification was high performance liquid chro- matography (HPLC). Separation was performed using a Xbridge ODS column with a mobile phase consisting of phosphate buffer pH (3.4): ac- etonitrile 70: 30 (v/v) with UV detection at 262 nm. The method showed high sensitivity with good linearity over the concentration range of 20 to 160 u00b5g mL -1 for RIV. The HPLC method was used to study the kinetics of RIV alkaline degradation that was found to follow a first-order reaction. The activation energy could be estimated from the Arrhenius plot and it wasfound to be 9.854 Kcal mole -1 .

E N D
id1775859 pdfMachine by Broadgun Software - a great PDF writer! - a great PDF creator! - http://www.pdfmachine.com http://www.broadgun.com Volume 16 Issue 3 ISSN : 0974-7419 Analytical Analytical CHEMISTRY Analytical Analytical CHEMISTRY An Indian Journal Full Paper Full Paper ACAIJ, 16(3) 2016 [119-127] Stability-indicating high performance liquid chromatographic deter- mination of rivastigmine with kinetic study of rivastigmine alkaline degradation Saud S.Bawazeer1, Waleed H.AlMalki2, Mohammad A.El-Sayed1,3* 1Department of Pharmaceutical Chemistry, Faculty of Pharmacy, Umm Al-Qura University, Makkah, P.O.Box 715, (SAUDI ARABIA) 2Department of Pharmacology, Faculty of Pharmacy, Umm Al-Qura University, Makkah, P.O.Box 715, (SAUDI ARABIA) 3Department of Analytical Chemistry, Faculty of Pharmacy, Cairo University, Kaser El-Aini Street, ET 11562, Cairo-(EGYPT) E-mail: boodim3@yahoo.com, maaga@uqu.edu.sa ABSTRACT KEYWORDS Rivastigmine; High performance liquid chromatography; Kinetic study. Stability-indicating high performance liquid chromatographic determina- tion of rivastigmine in its binary mixture with kinetic study of rivastigmine alkaline degradation Stability-indicative determination of rivastigmine hydrogen tartarate (RIV) in the presence of its degradate was investigated. The degradation product was isolated, via alkaline-degradation, characterized and confirmed. Se- lective quantification of RIV in bulk form, pharmaceutical formulations and/or in the presence of RIV degradate was demonstrated. The analytical technique adopted for quantification was high performance liquid chro- matography (HPLC). Separation was performed using a Xbridge ODS column with a mobile phase consisting of phosphate buffer pH (3.4): ac- etonitrile 70: 30 (v/v) with UV detection at 262 nm. The method showed high sensitivity with good linearity over the concentration range of 20 to 160 µg mL-1 for RIV. The HPLC method was used to study the kinetics of RIV alkaline degradation that was found to follow a first-order reaction. The activation energy could be estimated from the Arrhenius plot and it was found to be 9.854 Kcal mole-1. 2016 Trade Science Inc. - INDIA INTRODUCTION choline esterase inhibitor of the carbamate type. It is central nervous system selective used for the symp- tomatic treatment of Alzheimer’s disease.[2] (Put Fig- ure 1 here) Several methods have been reported for the de- termination of RIV, these include, spectrophotomet- ric[3-5], thin layer chromatographic[6], high perfor- mance liquid chromatographic[7-13], capillary zone Rivastigmine [123441-03-2] (Figure 1) is ethyl methyl carbamic acid 3-[(1S)-1-(dimethyl amino) ethyl phenyl ester, (S)-N-ethyl-3-[(1-dimethylamino) ethyl]-N-methyl phenyl carbamate]. C14H22N2O2, mol.wt 250.34[1] Rivastigmine is classified as a reversible acetyl-
Stability-indicating high performance liquid chromatographic determination . 120 ACAIJ, 16(3) 2016 Full Paper Full Paper with 85% phosphoric acid): acetonitrile 70: 30 (v/ v). The mobile phase was filtered through 0.45 ìm Millipore membrane filter and was degassed for 30 min in an ultrasonic bath prior to use. UV detection was done at 262 nm. The system was operated at ambient temperature. The flow rate was isocratic at 1.0 mL min-1 . a 0.45 ìm membrane filter, and were injected by the aid of a 25ìL Hamilton® analytical syringe. Materials and reagents Rivastigmine hydrogen tartrate (mol.wt 400.4) (ID 3102936) reference standard was kindly sup- plied by Novartis Pharm Co, its purity was certified to be 99.69%. Its purity was also checked in our laboratory according to the reported spectrophoto- metric method[5] (2nd derivative at 262 nm) and it was found to be 99.70 ± 0.578. Pharmaceutical formulations: Exelon® capsules batch number B 8173 and B 3003 (exp 3/2010), were purchased from the Egyptian market. Each capsule is claimed to contain 3 mg or 6 mg of rivastigmine hydrogen tartrate. Exelon® capsules are manufac- tured by Novartis Company (Basle, Switzerland). All chemicals used were of analytical grade and de-ionized water was HPLC grade. Sodium hydrox- ide, hydrochloric acid, methanol, chloroform, ethyl acetate, acetonitrile for HPLC, dipotassium hydro- gen phosphate anhydrous, sodium heptane sulpho- nate, phosphoric acid and triethylamine were ob- tained from Merck (Germany). Standard solutions RIV stock solution (0.5 mg mL –1) in acetoni- trile. RIV degradation product stock solution (0.5 mg mL -1) in acetonitrile. Procedures Degradation of rivastigmine [5] Five hundred milligrams of RIV were dissolved in 50 mL of 0.5 M sodium hydroxide and then re- fluxed at 100o temperature and then diluted with methanol. The de- graded solution and standard solution were spotted on HPTLC plates. The plates were placed in chro- matographic tanks previously saturated for 1 h with Figure 1 : Chemical structure of rivastigmine The samples were filtered also through electrophoresis[14, 15] and electrochemical[16, 17]. In modern analytical laboratory, there is a need for significant stability-indicating methods of analy- sis. From these procedures, only the spectrophoto- metric[5] HPLC[9], TLC[6] and electrochemical[16, 17] techniques were recommended as stability indicat- ing assays. Rivastigmine retention time in reference[9] was 8 min, which make the suggested method more rapid. The focus of the present study was to develop and validate simple stability-indicating method for the quantification of RIV in bulk form and/or in the presence of RIV alkaline-degradate. Moreover, us- ing the suggested method to monitor the kinetics of RIV degradation to solve problems encountered in quality control and to predict the expiry dates of phar- maceutical products. EXPERIMENTAL Instruments - Precoated HPTLC plates, (Macheray-Nagel (Germany)) silica gel 60 F245 20 x 20 cm, 0.2 nm thickness. - A Liquid chromatograph consisted of a Waters HPLC system serial no. 01757-3696 USA with Wa- ters 2998 PDA detector and Water e2695 separa- tion modules pump with auto injector used along with Waters XBrigdeTM C18 column (4.6 x 250 mm, 5ìm). Empower 2 software; Waters Corporation was uti- lized for data acquisition. Waters Corporation 34 Maple Street, Milford, Massachusetts The chromatographic conditions were: Station- ary phase: Waters XBrigdeTM C18 column (4.6 x 250 mm, 5ìm). Mobile phase: solution pH 3.4 (Dissolve 1.74 gm of dipotassium hydrogen phosphate anhy- drous and dilute to a volume of 900 mL with deionised water, add 1 mL triethylamine and 0.1 % sodium heptane sulphonate and adjust to a pH of 3.4 C for 20 min. 1 mL was cooled to room Analytical Analytical CHEMISTRY Analytical Analytical CHEMISTRY An Indian Journal
ACAIJ, 16(3) 2016 Mohammad A.El-Sayed et al. 121 Full Paper Full Paper L-1 NaOH and completed to the mark with the same solvent. These solutions were transferred into other clean dry conical flasks, and then refluxed in a ther- mostatically controlled water bath at 80 o min. 1.0 mL sample solutions were taken at 4.0 min intervals and then complete as described under (For studying the kinetic order of the reaction). The log % of remaining concentration against time was con- structed for different molarities of NaOH and the rates constant and t1/2 were calculated. For studying the effect of the temperature on the reaction rate Three portions each of 0.25 g of RIV were dis- solved in 50 mL measuring flasks and completed to volume with 0.5, 0.375, and 0.25 mole L-1 NaOH respectively. These solutions were transferred into other clean dry conical flasks and then refluxed in a thermostatically controlled water bath at 60 o o C, 80 o tions were taken at 4.0 min intervals and then com- plete as described under (For studying the kinetic order of the reaction). The log % of remaining con- centration against time at different temperatures was plotted. Also the Arrhenius plot for the effect of tem- perature on the rate of hydrolysis was constructed. the mobile phase of methanol: butanol: H2O: NH4OH (5:4:1:0.01 v/v/v/v) and then air-dried. The spots were visualized under UV light at 254 nm. The me- dium was rendered acidic using concentrated hy- drochloric acid to precipitate the degradation prod- uct. The degradation product was filtered and then recrystallized from isopropyl alcohol. Linearity C for 20 Portions 1.0- 8.0 mL from RIV stock solution (0.5 mg mL-1) were transferred separately into a se- ries of 25 mL measuring flask then completed to vol- ume with acetonitrile. 25 ìL of the previous solu- tions were injected into the liquid chromatograph using the chromatographic conditions described un- der 2.1. Instruments. The corresponding peak areas were measured and calibration curve representing the ratio of the relative peak area of RIV to that of the external standard (30 ìg mL-1 of RIV) was con- structed, versus the corresponding concentrations of RIV in ìg mL-1. Kinetic studies For studying the kinetic order of the reaction C, 70 C and 90 o C for 20 min. 1.0 mL sample solu- Into a 50-mL measuring flask, 0.25 g of RIV in 0.5 M NaOH was dissolved and completed to the mark with the same solvent. This solution was trans- ferred into another clean dry conical flask and re- fluxed in a thermostatically controlled water bath at 80 o at 4.0 min intervals, i.e after 4, 8, 12, 16 and 20 min placed into 25-mL measuring flasks, flasks half filled with cold acetonitrile, neutralized with 1.0 mL of cold 0.5 M hydrochloric acid (neutralize to stop the hydrolysis reaction) and the volume was completed with cold acetonitrile. The solutions (initial concen- tration Co = 200 ìg mL-1) were injected in the liquid chromatograph using the chromatographic conditions described above. The concentration of RIV was cal- culated from the regression equation. The log % of remaining concentration against time was plotted. For studying the effect of NaOH concentration on the reaction rate Into a series of 50 mL measuring flasks, 0.25 g of RIV were dissolved in 0.5, 0.375, and 0.25 mole RESULTS AND DISCUSSION High performance liquid chromatographic analy- sis A simple isocratic high-performance liquid chro- matographic method was developed for the deter- mination of RIV in the presence of RIV degradation product without prior separation. To optimize the HPLC assay parameters, type of column and its di- mensions, mobile phase conditions, and choice of detection wavelength were investigated. Different types of stationary phase C8 and a ZORBAX ODS column with different dimensions and particle size were used. It was found that the ZORBAX ODS col- umn (250 mm x 4.6 mm I.D) with a particle size of 5 ìm gave the most suitable resolution. The mobile phase was chosen after several trials to reach the optimum stationary/mobile-phase matching. The peak shape improved dramatically by increasing the C for 20 min. 1.0 mL sample solutions were taken Analytical Analytical CHEMISTRY Analytical Analytical CHEMISTRY An Indian Journal
Stability-indicating high performance liquid chromatographic determination . 122 ACAIJ, 16(3) 2016 Full Paper Full Paper Figure 2 : Liquid chromatographic separation of RIV(40 ìg mL-1) and RIV degradation product (40 ìg ml-1) using the chromatographic conditions described in the text TABLE 1 : Parameters of system suitability test of HPLC method Parameter Obtained value Rivastigmine Reference value R > 2 Deg.product 9.12 Resolution (R) T (tailing factor) (relative retention) k' (column capacity) N (column efficiency) HETP 1.15 1.0 T = 1 for a typical symmetric peak > 1 1- 10 acceptable Increases with efficiency of the separation The smaller the value, the higher the column efficiency 2.14 5.42 206.05 0.12 2 100 0.25 standard method for calibration. The regression equations were computed and found to be: A= 0.4637 C + 0.0303 r = 0.9996 Where A is the relative peak areas to that of the ex- ternal standard, C is the concentration in ìg mL-1 for RIV and r is the correlation coefficient. HPLC validation percentage of buffer to acetonitrile in the mobile phase[18]. Tailing of the drug peak was reduced by the addition of triethyl amine. Optimum separation was obtained with a mobile phase consisting of so- lution pH 3.4 added to it 1 mL triethylamine and 0.1 % sodium heptane sulphonate: acetonitrile 70: 30 (v/v) with a retention time of 6.42 ± 0.03 min. for RIV and 3.00 ± 0.02 min. for RIV degradation prod- uct. (Figure 2). System suitability parameters were tested by calculating the capacity factor, tailing fac- tor, the sensitivity factor, column efficiency, and se- lectivity factor (resolution)[19-22] [TABLE 1]. The chromatographic system described in this work al- lowed complete base line separation of RIV from its degradation product. Linear relationships were obtained between the relative peak area at the selected wavelength 262 nm and the corresponding concentrations in the range of 20- 160 ìg mL-1 for RIV by adopting the external The selectivity and specificity of the proposed method was proved by the analysis of laboratory prepared mixtures containing different ratios of the selected analytes. (TABLE 2) To ascertain the accuracy of the proposed pro- cedure, it was successfully applied for the determi- nation of RIV in Exelon capsules (TABLE 3). It is clear from the table that the company method failed to quantify RIV in the expired Exelon capsules. The validity was assessed by applying the standard ad- Analytical Analytical CHEMISTRY Analytical Analytical CHEMISTRY An Indian Journal
ACAIJ, 16(3) 2016 Mohammad A.El-Sayed et al. 123 Full Paper Full Paper TABLE 2 : Determination of rivastigmine in laboratory prepared mixtures by the proposed HPLC method Concentration (µg mL-1) Ratio RIV: Deg. product HPLC method Recovery% RIV 98.09 98.77 99.67 101.12 100.21 99.45 100.32 99.66 1.014 RIV Deg.product 140 120 100 80 60 40 20 20 40 60 80 100 120 140 7: 1 3: 1 5: 3 1: 1 3: 5 1: 3 1: 7 Mean S.D. TABLE 3 : Determination of rivastigmine in exelon capsules by the proposed methods HPLC method Found % ± S.D.**of RIV 99.28 ± 1.124 80.46 ± 1.110 Reported method * Found % ± S.D.**of RIV 99.54 ± 0.954 80.55 ± 1.107 Batch number B 8173 B 3003 (exp.date 3/2010) * Stability indicating spectrophotometric method (2nd derivative at 262 nm)[5]; ** Average of four determinations. TABLE 4 : Statistical comparison for the results obtained by the proposed methods and the reported method Item Mean S.D. Variance N F test Student's t test HPLC method 100.09 0.761 0.579 8 1.76 (4.362) 1.08 (2.179) Reported method* 99.58 1.011 1.022 6 The figures in parenthesis are the corresponding tabulated values at P=0.05[23]; * Stability indicating spectrophotometric method (2nd derivative at 262 nm) (5). dition technique. The small relative standard devia- tions indicate that the method is accurate. The results obtained for the analysis of RIV in the pure powdered form were statistically compared with those from a previously reported method[5]. A significant difference was not observed[23]. (TABLE 4) The precision of the suggested method was also expressed in terms of relative standard deviation of the inter-day and intra-day analysis. The robustness of the HPLC method was investigated by analysis of samples under a variety of experimental conditions such as small changes in the pH (3.0–3.5), and chang- ing the column using a 250 mm × 4.6 mm i.d. C18 Lichrosorb 10 ìm analytical column. The effect on retention time and peak parameters was studied. It was found that the method was robust when the col- umn and the mobile phase pH were varied. During these investigations, the retention times were modi- fied, however the areas and peaks symmetry were conserved. Changes in instruments or personnel did not alter the results, which indicate the ruggedness of the proposed method. The obtained assay param- eters and a validation sheet[19] are presented in TABLE 5. Kinetics of the degradation The linear relationship (Figure 3) between the log % of remaining concentration against time indi- cated first-order degradation. Since the hydrolysis was performed in a large excess of NaOH (0.5 mole L-1), therefore it follows a pseudo-first order reac- Analytical Analytical CHEMISTRY Analytical Analytical CHEMISTRY An Indian Journal
Stability-indicating high performance liquid chromatographic determination . 124 ACAIJ, 16(3) 2016 Full Paper Full Paper Figure 3 : First order plot of the hydrolysis of RIV (1000 mg %) with 0.5 M NaOH at 80 o C TABLE 5 : Assay parameters and method validation for rivastigmine[19] concentration is negligible compared with the change in concentration of the other reactant (drug). Different parameters that affect the rate of the reaction were studied. The temperature dependence of rivastigmine degradation was studied by conduct- ing the reaction at different temperatures using dif- ferent concentrations of the base solution (Figure 4). At each temperature the rate constant and t1/2 were calculated then the log of the rate constant was plot- ted against the reciprocal of the temperature in Kelvin units (Arrhenius plot, Figure 5) to demon- strate the effect of temperature on the rate constant. It was concluded that as the temperature increased the rate of hydrolysis increased with a decrease in the t1/2 (TABLE 7). Also, the energy of activation was determined by calculating the rate constant from the following equation[25]. 2 k = ) 2 T 1 T R 303 . 2 Parameter HPLC method 20-160 0.4637 0.0303 100.09 0.761 0.579 0.760 0.9996 0.893,0.868 1.265,1.147 Range (µgmL-1) Slope Intercept Mean S.D. Variance Correlation coefficient (r) Coefficient of variation * RSD%a *RSD%b *RSD%a, RSD%b:the intra-day, inter-day respectively (n=5) relative standard deviation of concentrations (80 and 120 µg mL-1) tion rate[24] which is the term used when two reac- tants are involved in the reaction but one of them is in such a large excess (NaOH) that any change in its Ea T 2 T 1 log ( k 1 TABLE 6 : Kinetic data of rivastigmine alkaline degradation k (min-1) 0.160 0.105 0.070 0.047 0.120 0.077 0.051 0.035 0.079 0.057 0.037 0.022 Molarity of NaOH Temperature 90o 80o 70o 60o 90o 80o 70o 60o 90o 80 o 70 o 60 o t1/2 (min) 4.33 6.60 9.90 14.73 5.77 9.02 13.59 19.82 8.77 12.15 18.72 31.51 C C C C C C C C C C C C 0.5 M 0.375 M 0.25 M Analytical Analytical CHEMISTRY Analytical Analytical CHEMISTRY An Indian Journal
ACAIJ, 16(3) 2016 Mohammad A.El-Sayed et al. 125 Full Paper Full Paper Figure 4 : First order plot of the hydrolysis of RIV (1000 mg %) with 0.5M, 0.375 and 0.25 NaOH at different temperatures Where “Ea” is the activation energy, “T1” and “T2” are the two temperatures degrees in Kelvin, “R” is the gas constant, and “k1” and “k2” are the rate con- stants at the two temperatures used. The calculated “Ea” was found to be 9.854 Kcal mole-1 which was a comparatively low value for amides, suggesting the instability in alkaline me- dium[26]. Another factor that affects the rate of the reac- tion is the base strength of NaOH, thus different nor- malities were used to study the hydrolysis reaction. The rate of hydrolysis increased with an increasing NaOH concentration, although the effect was minor compared to the effect of temperature (Figure 4) and (TABLE 6). In conclusion, the alkaline hydrolysis of rivastigmine was found to follow a pseudo first or- der reaction rate. Also the reaction rate increases with increase in the temperature and the strength of the alkaline solution. Analytical Analytical CHEMISTRY Analytical Analytical CHEMISTRY An Indian Journal
Stability-indicating high performance liquid chromatographic determination . 126 ACAIJ, 16(3) 2016 Full Paper Full Paper Figure 5 : Arrhenius plot for the hydrolysis of RIV (1000 mg %) with 0.5, 0.375 and 0.25 M NaOH M.K.AbdEl-Rahman; (Spectrophotometric and spectrodensitometric methods for the determination of rivastigmine hydrogen tartrate in presence of its degradation product) Drug Test Anal., 2(5), 225- 233 (2010). K.Arumugam, G.Sundararajan, P.Musmade, A.Ranjithkumar, S.Mallayasamy, N.Udupa, (Stabil- ity-Indicating HPTLC Determination of Rivastigmine in the Bulk Drug and in Pharmaceutical Dosage Forms) Journal of Planar Chromatography, 20(6), 457-461 (2007). F.Pommier, R.Frigola; (Quantitative determination of rivastigmine and its major metabolite in human plasma by liquid chromatography with atmospheric pressure chemical ionization tandem mass spectrom- etry) Journal-of-Chromatography, 784(2), 301-313 (2003). M.K.Srinivasu, B.M.Rao, B.S.Sundar Reddy, P.R.Kumar, K.B.Chandrasekhar, P.K.Mohakhud; (A validated chiral liquid chromatographic method for the enantiomeric separation of Rivastigmine hydro- gen tartarate, a cholinesterase inhibitor) JPBA, 38(2), 320–325 (2005). B.M.Rao, M.K.Srinivasu, K.P.Kumar, N.Bhradwaj, R.Ravi, P.K.Mohakhud, G.O.Reddy, P.R.Kumar; (A stability indicating LC method for Rivastigmine hy- drogen tartrate) JPBA, 37(1), 57–63 (2005). [10] S.V.Frankfort, M.Ouwehand, M.J.Van.Maanen, H.Rosing, L.R.Tulner, J.H.Beijnen; (A simple and sensitive assay for the quantitative analysis of rivastigmine and its metabolite NAP 226-90 in hu- man EDTA plasma using coupled liquid chromatog- raphy and tandem mass spectrometry) Rapid Commun Mass Spectrom, 20(22), 3330-3336 (2006). CONCLUSION The proposed HPLC method provides a simple, sensitive, and selective method suitable for the qual- ity control analysis of RIV either in the pure pow- dered form or available pharmaceutical dosage forms with no interference from excipients or the degradation product. [6] ACKNOWLEDGEMEN [7] The authors would like to thank Institute of Sci- entific Research and Revival of Islamic Heritage at Umm Al-Qura University (Project ID 43410009) for the financial support. [8] REFERENCES [1] The Merck index, 15th Edition, Merck Research laboratories: White house station, (2013). [2] Martindale; The complete drug reference 37th Edtion, Pharmaceutical Press, London, (2011) [3] S.Dermis Gungor; (A comparative study of zero or- der and derivative spectrophotometric methods for the determination of rivastigmine in single dosage form) Ank.series B, 50(1), 13-33 (2004). [4] O.Prasad, L.Sinha, N. Misra, V. Narayan, N.Kumar; (Analysis of vibrational, structural, and electronic properties of rivastigmine by density functional theory) journal of applied spectroscopy, 77(4), 468- 478 (2010). [5] M.Y.Salem, A.M.El-Kosasy, M.G.El-Bardicy, [9] Analytical Analytical CHEMISTRY Analytical Analytical CHEMISTRY An Indian Journal
ACAIJ, 16(3) 2016 Mohammad A.El-Sayed et al. 127 Full Paper Full Paper [11] H.Amini; A Ahmadiani, (High-performance liquid chromatographic determination of rivastig-mine in human plasma for application in pharmacokinetic studies) Iranian Journal of Pharmaceutical Research, 9(2), 115-121 (2010). [12] S.Alexandar, R.Diwedi, M.J.N.Chandrasekhar; (A validated RP-HPLC method for estimation of Rivastigmine in pharma- ceutical formulations) Der Pharmacia Lettre, 3(3), 421-426 (2011). [13] K.Arumugam, M.R.Chamallamudi, S.Mallayasamy, R.Mullangi, S.Ganesan, L.Jamadar, A.Ranjithkumar, N.Udupa; (High performance liquid chromatographic fluorescence detection method for the quantifica- tion of rivastigmine in rat plasma and brain: applica- tion to preclinical pharmacokinetic studies in rats) Journal of young pharmacists, 3(4), 315-321 (2011). [14] A.Kavalirova, M.Pospisilova, R.Karlicek; (Enantio- meric analysis of rivastigmine in pharmaceuticals by cyclodextrin-modified capillary zone electrophore- sis), Anal.Chim.Acta, 525(1), 43–51 (2004). [15] I.N.Nicolaou, C.P.Kapnissi-Christodoulou; (Simul- taneous determination of nine acetylcholinesterase inhibitors using micellar electrokinetic chromatogra- phy) Journal of Chromatographic Science, (49), 265- 271 (2011). [16] A.M.EL-Kosasy, M.Y.Salem, M.G.EL-Bardicy, M.K.Abdelrahman; (Miniaturized membrane sensors for the determination of rivastigmine hydrogen tar- trate) Chem.Pharm.Bull., 56, 753-757 (2008). [17] M.A.Elsayed; (Advantages of the incorporation of 2-hydroxy propyl beta cyclodextrin and calixarene as ionophores in potentiometric ion-selective elec- trodes for rivastigmine with a kinetic study of its alkaline degradation) Sensors and Actuators: B chemical, 190, 101-110 (2014). [18] A.M.Shehatta, M.A.El-Sayed, M.G.El-Bardicy, M.F.El-Tarras; J.Pharm.Biomed.Anal., 38, 72-78 (2005). [19] The united states pharmacopeia (USP XXVIII), National Formulary (NF23) The United States Pharmacopeial Convention, Inc.Rockville, MD, (2005). [20] A.M.Relva, H.J.Chaves, J.Rev.Port.Farm., 43(4), 37 (1993). [21] W.Andrea, R.Phyllis: HPLC and CE principles and practice, Academic Press, London, 7 (1997). [22] A.John; Adamovics: Chromatographic analysis of pharmaceuticals, 2nd Edition, Marcel Dekker,Inc., NewYork, 74, 11 (1997). [23] Loyd V.Allen, Remington; The science and practice of pharmacy, 19th Edition Easton, Pennsylvania, 116 (1995). [24] A.T.Florence, D.Attwood; Physical principles of pharmacy, 2nd Edition, Macmillan Press, (1998). [25] A.Martin, J.Swarbrick, A.Cammarata: Physical Pharmacy, 3rd Edition, Lea and Febiger (Philadel- phia) USA, (1983) 359. [26] M.J.Pilling, P.W.Seakins; Reaction kinetics, OUP, (1995) T.Ashok, M.A.Ferreira; Analytical Analytical CHEMISTRY Analytical Analytical CHEMISTRY An Indian Journal