Download
1 / 41
580 likes | 1.81k Views
HIGH PERFORMANCE LIQUID CHROMATOGRAPHY (HPLC). HIGH PERFORMANCE LIQUID CHROMATOGRAPHY. High Performance Liquid Chromatography (HPLC) is one of the most widely used techniques for identification, quantification and purification of mixtures of organic compounds.

E N D
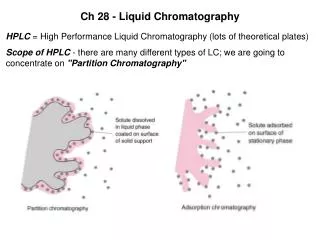
HIGH PERFORMANCE LIQUID CHROMATOGRAPHY • High Performance Liquid Chromatography (HPLC) is one of the most widely used techniques for identification, quantification and purification of mixtures of organic compounds. • In HPLC, as in all chromatographic methods, components of a mixture are partitioned between an adsorbent (the stationary phase) and a solvent (the mobile phase). • The stationary phase is made up of very small particles contained in a steel column. Due to the small particle size (3-5 um), pressure is required to force the mobile phase through the stationary phase. • There are a wide variety of stationary phases available for HPLC. In this lab we will use a normal phase(Silica gel), although reverse phase (silica gel in which a 18 carbon hydrocarbon is covalently bound to the surface of the silica) columns are currently one of the most commonly used HPLC stationary phases.
HIGH PERFORMANCE LIQUID CHROMATOGRAPHY http://www.chemistry.nmsu.edu/Instrumentation/Waters_HPLC_MS_TitlePg.html
TLC vs High Performance Liquid Chromatography (HPLC) HPLC Optimization http://www.labhut.com/education/flash/introduction07.php
HPLC – Optimizing Separation Skoog and Leary: Principals of Instrumental Analysis, 5th ed. Suanders, 1998
HPLC - Resolution • Resolution (RS) of a column provides a quantitative measure of its ability to separate two analytes Rs = DZ /1/2(WA+WB) Rs =
HPLC - Resolution Rs Skoog and Leary: Principals of Instrumental Analysis, 4th ed. Suanders, 1992
HPLC - Resolution • Capacity Factor (k’): Also called retention factor. Is a measure for the position of a sample peak in the chromatogram. • k’ = (tR1-to)/to • specific for a given compound and constant under constant conditions • A function of column and mobile phase chemistry • Primarily applicable under isocratic conditions • In general, a change in the k’ of one peak will move all peaks in the same direction. • Selectivity Factor (a): Also called separation or selectivity coefficient is defined as • a = k2’/k1’ = (tR2-to) / (tR1-to) • A function of column and mobile phase chemistry • Primarily applicable under isocratic conditions • Changes in selectivity will affect different compounds in different ways. Skoog and Leary: Principals of Instrumental Analysis, 4th ed. Suanders, 1992
HPLC - Resolution • Theoretical Plates (N): The number of theoretical plates characterizes the quality or efficiency of a column. • N = 5.54 [(tR) / w1/2]2 (N = 16 (tR/W)2) Skoog and Leary: Principals of Instrumental Analysis, 4th ed. Suanders, 1992
HPLC - Resolution Theoretical Plates (N): The number of theoretical plates characterizes the quality or efficiency of a column. N = 5.54 [(tR) / w1/2]2 (N = 16 (tR/W)2) Plate Height (H): The height equivalent to a theoretical plate (HEPT = H) H = L / N Resolution (Rs) depends on the number of theoretical plates: Rs = Skoog and Leary: Principals of Instrumental Analysis, 4th ed. Suanders, 1992
Skoog and Leary: Principals of Instrumental Analysis, 4th ed. Suanders, 1992
HPLC - General Elution Problem Skoog and Leary: Principals of Instrumental Analysis, 5th ed. Suanders, 1998
HIGH PERFORMANCE LIQUID CHROMATOGRAPHY (TLC vs Normal Phase and Reverse Phase HPLC)
Reverse Phase HPLC Skoog and Leary: Principals of Instrumental Analysis, 5th ed. Suanders, 1998
Normal Phase vs. Reverse Phase HPLC Skoog and Leary: Principals of Instrumental Analysis, 5th ed. Suanders, 1998
RP-HPLC – Stationary Phase Skoog and Leary: Principals of Instrumental Analysis, 5th ed. Suanders, 1998
RP-HPLC – Mobile Phase vs k’ Skoog and Leary: Principals of Instrumental Analysis, 5th ed. Suanders, 1998
RP-HPLC – Mobile Phase (k’, a) Skoog and Leary: Principals of Instrumental Analysis, 5th ed. Suanders, 1998
RP-HPLC – Mobile Phase (a) Skoog and Leary: Principals of Instrumental Analysis, 5th ed. Suanders, 1998
RP-HPLC - Example Alltech Chromatography Sourcebook, 2004-04 catalog
RP-HPLC - Optimization Alltech Chromatography Sourcebook, 2004-04 catalog
RP-HPLC – Gradient Elution Alltech Chromatography Sourcebook, 2004-04 catalog
HPLC – Resolution vs Column Efficiency (N, H) H = L / N van Deemter Equation H = A + B/u +(Cs + Cm)u Skoog and Leary: Principals of Instrumental Analysis, 5th ed. Suanders, 1998
HPLC - Column Efficiency Skoog and Leary: Principals of Instrumental Analysis, 5th ed. Suanders, 1998
HPLC - Column Efficiency van Deemter Equation H = A + B/u +Cu Skoog and Leary: Principals of Instrumental Analysis, 5th ed. Suanders, 1998
HPLC - Column Efficiency H = A + B/u + Cu A = 2l dp • l depends on particle size distribution, the narrower the distribution the smaller the l • dp = particle size • Independent of mobile phase flow rate • Also known as eddy diffusion Skoog and Leary: Principals of Instrumental Analysis, 5th ed. Suanders, 1998
HPLC - Column Efficiencyparticle size Skoog and Leary: Principals of Instrumental Analysis, 5th ed. Suanders, 1998
HPLC Column EfficiencyLongitudinal Diffusion (B) H = A + B/u + Cu B/u = 2gDM/u • g = constant depending on quality of packing • DM is the mobile phase diffusion coefficient • Inversely related to mobile phase flow rate
HPLC Column EfficiencyMass Transfer (Cs + Cm) H = A + B/u + (Cs + Cm)u CS = fS(k’)df2/ DS CM = fM(k’)dp2/ DM • DM is the mobile phase diffusion coefficient • DS is the stationary phase diffusion coefficient • df is film thickness • dp is particle size • Directly related to mobile phase flow rate Skoog and Leary: Principals of Instrumental Analysis, 5th ed. Suanders, 1998
RP-HPLC – Variables Alltech Chromatography Sourcebook, 2004-04 catalog
HPLC OF ANALGESICS - UV Detection Standard Analgesics Gradient = 0 min: 100% EtOAC (+ 0.2% HOAc) 3 min: 100% EtOAC (+ 0.2% HOAc) 5 min: 15% MeOH, 85% % EtOAc (+ 0.2% HOAc) 8 min: 15% MeOH, 85% % EtOAc (+ 0.2% HOAc) 10 min: 100% EtOAC (+ 0.2% HOAc) SiO2 Flow Rate = 1 mL/min UV detector set at 240 nm 2.82 min Acetaminophen 1.48 min. Aspirin 7.11 min. Caffeine 1.35 min. Ibuprofen
HPLC OF ANALGESICS - UV Detection Area % Aspirin 19.5% Acetaminophen 50.0% Caffeine 20.5% Excedrin ES 250 mg aspirin 250 mg acetaminophen 65 mg caffeine Question The peak areas of aspirin and acetaminophen are very different, even though they are present in equal amounts (250mg/tablet) in Excedrin ES. Caffeine is present at ~ ¼ the concentration of aspirin (65 mg/tablet vs. 250 mg/tablet), but it’s peak area is greater than the peak area of aspirin. WHY? UV Absorbance of analgesics vs UV setting of detector
HPLC: Peak Area vs Detector setting UV Max Aspirin 225, 296 nm Acetaminophen 248 nm Caffeine 272 nm Area % Aspirin 19.5% Acetaminophen 50.0% Caffeine 20.5% Detector set at 240 nm Detector set at 254 nm Area % Aspirin 7.3% Acetaminophen 81.9% Caffeine 10.8% Detector set at 280 nm Area % Aspirin 24.8% Acetaminophen 39.3% Caffeine 35.9%
HPLC – UV Detection • Figure 2. HPLC (SiO2) of crude tumeric extract. • Gradient 0-2 min, 4% EtOAc/Hexane; 2-9 min 4 to 80% EtOAc; • 9-11 min , 80% EtOAc/hexane; 11-13 min, 80 to 4% EtOAc/hex, 13-15 min, 4% EtOAc /hexane. • Detector set at 420 nm. • Detector set at 254 nm. • Detector set at 254 nm (0-3.5 min), 420 nm 3.5-15 min. (A) (B) (C)