Download
1 / 10
100 likes | 114 Views
FiveSimple, rapid, sensitive, accurate and precise stability-indicating spectrophotometric methodswere developed for the determination of Etilefrinehydrochloride (ETF)in bulk powder and in pharmaceutical preparation. Method (A) Ratio derivative method( 1DD),Method (B) Ratio difference method, Method (C)Mean centering method, Method (D) Dual wavelength method and Method (E)Area under the curve (AUC). These methodswere used for the determination of Etilefrine hydrochloride in binary mixture with (chlorophenermine maleate)(CPM). These methodswere validated and successfully applied to the determination of Balkisu00c6capsule with an average percent recovery u00b1 RSD% of 100.26u00b10.622 for method (A), 99.73 u00b1 0.583 for method (B), 99.15 u00b1 0.670 for method (C), 99.63 u00b1 0.862 for method (D) and 99.41 u00b1 1.225 for method (E). The obtained results werestatistically compared with those of the reported method by applying t-test and F-test at 95% confidence level and no significant difference was observed regarding accuracy and precision.

E N D
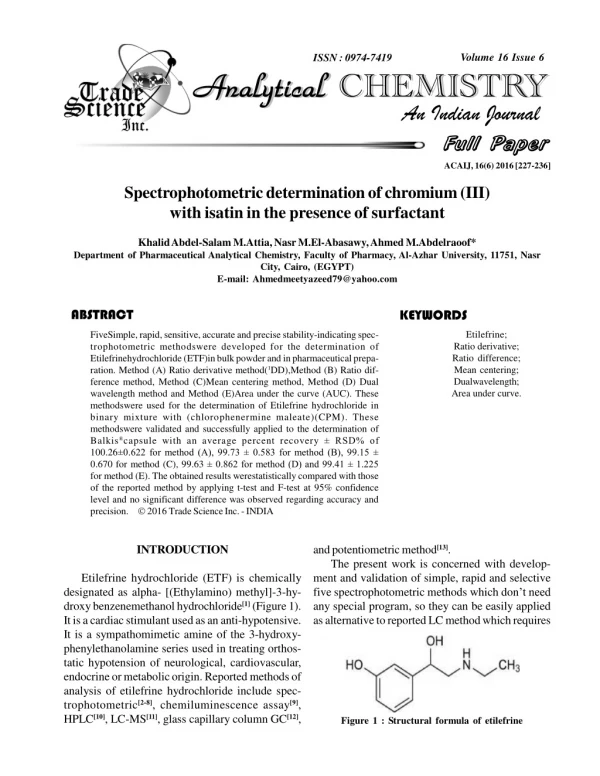
id6508765 pdfMachine by Broadgun Software - a great PDF writer! - a great PDF creator! - http://www.pdfmachine.com http://www.broadgun.com Volume 16 Issue 6 ISSN : 0974-7419 Analytical Analytical CHEMISTRY Analytical Analytical CHEMISTRY An Indian Journal Full Paper Full Paper ACAIJ, 16(6) 2016 [227-236] Spectrophotometric determination of chromium (III) with isatin in the presence of surfactant Khalid Abdel-Salam M.Attia, Nasr M.El-Abasawy, Ahmed M.Abdelraoof* Department of Pharmaceutical Analytical Chemistry, Faculty of Pharmacy, Al-Azhar University, 11751, Nasr City, Cairo, (EGYPT) E-mail: Ahmedmeetyazeed79@yahoo.com ABSTRACT KEYWORDS Etilefrine; Ratio derivative; Ratio difference; Mean centering; Dualwavelength; Area under curve. FiveSimple, rapid, sensitive, accurate and precise stability-indicating spec- trophotometric methodswere developed for the determination of Etilefrinehydrochloride (ETF)in bulk powder and in pharmaceutical prepa- ration. Method (A) Ratio derivative method(1DD),Method (B) Ratio dif- ference method, Method (C)Mean centering method, Method (D) Dual wavelength method and Method (E)Area under the curve (AUC). These methodswere used for the determination of Etilefrine hydrochloride in binary mixture with (chlorophenermine maleate)(CPM). These methodswere validated and successfully applied to the determination of Balkis®capsule with an average percent recovery ± RSD% of 100.26±0.622 for method (A), 99.73 ± 0.583 for method (B), 99.15 ± 0.670 for method (C), 99.63 ± 0.862 for method (D) and 99.41 ± 1.225 for method (E). The obtained results werestatistically compared with those of the reported method by applying t-test and F-test at 95% confidence level and no significant difference was observed regarding accuracy and precision. 2016 Trade Science Inc. - INDIA INTRODUCTION and potentiometric method[13]. The present work is concerned with develop- ment and validation of simple, rapid and selective five spectrophotometric methods which don’t need any special program, so they can be easily applied as alternative to reported LC method which requires Etilefrine hydrochloride (ETF) is chemically designated as alpha- [(Ethylamino) methyl]-3-hy- droxy benzenemethanol hydrochloride[1] (Figure 1). It is a cardiac stimulant used as an anti-hypotensive. It is a sympathomimetic amine of the 3-hydroxy- phenylethanolamine series used in treating orthos- tatic hypotension of neurological, cardiovascular, endocrine or metabolic origin. Reported methods of analysis of etilefrine hydrochloride include spec- trophotometric[2-8], chemiluminescence assay[9], HPLC[10], LC-MS[11], glass capillary column GC[12], Figure 1 : Structural formula of etilefrine
Spectrophotometric determination of chromium (III) . 228 ACAIJ, 16(6) 2016 Full Paper Full Paper time, experience, expensive instruments and sol- vents. prepared standard solutions were scanned from 200 - 400 nm and stored in the computer. For the deter- mination of ETF in presence of its interferent prod- uct, the stored spectra of ETFwere divided by the spectrum of 60 µg ml-1CPM, smoothed with Äë = 2 nm and scaling factor= 1, then the first derivative of the ratio spectra (1DD) with Äë = 2 nm was ob- tained. The amplitude of the first derivative trough of (ETF /CPM) was measured at 279 nm. A calibra- tion graph relating the trough amplitude at 279 nm to the corresponding concentrations in µg ml-1of ETFwas constructed alternatively, the regression equation was derived. Method B (Ratio difference method) Aliquots equivalent to (0.1 – 1 mg) were accu- rately transferred from ETF standard stock solution (100 µg ml-1) into a series of 10 - ml volumetric flasks then completed to volume with methanol. The spectra of the prepared standard solutions were scanned from 200 - 400 nm and stored in the com- puter, For the determination of ETFin presence of CPM, the stored spectra of ETFwere divided by the spectrum of (60 µg ml-1) of CPM. The amplitude difference at 260 and 281 nm (dP260– 281) was plotted against the corresponding ETF concentra- tion in µg ml-1 and the regression equation was com- puted. Method C (Mean centering method) Aliquots equivalent to (0.1 – 1 mg) of ETF work- ing standard solution were accurately transferred into a series of 10 - ml volumetric flasks then completed to volume with methanol. The spectra of the pre- pared standard solutions were scanned from 200 - 400 nm using methanol as a blank and stored in the computer. The absorption spectra of ETFwere di- vided by the spectrum of (60 µg ml-1) of CPM. The amplitude of the mean centered peak of (ETF / CPM) was measured at 283 nm. A calibration graph relat- ing the peak amplitude to the corresponding concen- trations in µg ml-1 of ETF was constructed. MethodD(Dual wavelength method) Aliquots of standard ETF solution in methanol (100 µg ml-1) containing (0.1 – 1 mg) of the drug were added to a series of 10 -ml volumetric flasks MATERIALS AND METHODS Apparatus Shimadzu UV-Vis. 1650 Spectrophotometer (Ja- pan). Jenway, pH meter 3510 (Jenway, USA). Hot plate (Torrey pines Scientific, USA). rotary evaporator (scilogex, USA) Materials and reagents Pure drug samples of CPM and ETF were kindly supplied by EIPICO Pharmaceuticals, 10th of Ramadan City, Egypt. Their purity was checked and found to be 99.42 ± 0.662 % and 99.09 ± 0.771 % according to the BP 24 for CPM and ETF, respectively. Balkis® capsules (EIPICO Pharmaceuticals) Batch No. 1108630, labeled to contain 6 mg chlorophenermine and 20 mg etilefrine per cap- sule both bound to an ion exchangeresin were purchased from local pharmacies Water usedthroughouttheprocedureswas freshlydouble distilled. Standard Solution A stock solution of Etilefrine (100ìg/ml) was prepared by dissolving 10 mg of Etilefrine in 50 ml of methanol and complete to 100 ml with methanolandstock solution of Chlorophenermine(100 ìg/ml) was prepared by dissolving 10 mg of CPM in 50 ml of methanol and complete to 100 ml with methanol and was further diluted with the same sol- vent as appropriate Procedure Construction of the calibration curves (general procedures): Method A(Ratio derivative method) Aliquots equivalent to(0.1 – 1mg) ETFand (0.1– 1mg) CPMwere accurately transferred from their standard working solution (100 µg ml-1) into two separate series of 10 ml volumetric flasks then com- pleted to volume with methanol. The spectra of the Analytical Analytical CHEMISTRY Analytical Analytical CHEMISTRY An Indian Journal
ACAIJ, 16(6) 2016 Ahmed M.Abdelraoof et al. 229 Full Paper Full Paper and then diluted to the mark with methanol. The util- ity of dual wavelength data processing programis to calculate the unknown concentration of acomponent of interest present in a mixture containingETF andCPM interfering component by the mechanism of theabsorbance difference between two points on themixture spectra. This is directly proportional to theconcentration of the component of interest, independentof the interfering components. From the overlay of two drugsfor estimation of ETF, two wave- lengths selected (244 nm and 269nm)wherethe CPM shows same absorbance. Six working standard so- lutions havingconcentration 10, 20, 30, 50, 90 and 100the drugs were prepared separately in methanol and the absorbance at 244 nm and 269 nm were mea- sured and absorptive coefficients were calculated usingcalibration curve. Method E(Area under curve method) determine the content of ETF in commercial Balkis®capsules(each capsule labeled to contain20 mg ETF and6mg CPM)The following procedures were carried out as a modification to the manufac- turer method of analysis obtained by personal com- munication[6][25]., The contents of 12 capsules were carefully emptied and weighed. A portion of the con- tents equivalent to the average weight of two cap- sules and half was accurately weighed and trans- ferred toa250-mlconicalflask. This portion was washed three times with 100 ml of warm double distilled water using amagneticstirrer for10 minutes each Extraction was carried out using the following procedure i. Extracting solution was prepared as follows: dissolve 5 g of sodiumchloride dissolved in 220 mlof distilledwater, and then mixed with 20 ml of 25% hydrochloricacid and 760 ml methanol. ii. The extraction was repeated using 100 ml of the extracting solution but the extraction was con- tinued overnight (12hours). iii. The extracting solution was collected, in a1000- ml evaporating flask, by decantation, keeping the resinin the extracting vessel. iv. The extracting solution was trans ferred by the same method to the evaporating flask. v. The pH was adjusted to7 using 20 % W/V so- dium hydroxide solution. Methanol was evaporatedusing arotaryevaporator (Rotavap). Then extracted the remaining by using double distilled water,and filtered through0.5ìm What manfilterpaper. From the above prepared solu- tion, further dilutions were prepared in the lin- earity range using methanol Calculation optimization After extraction, Etilefrine will be available in the final extraction solution as etilefrineHClbut (ETF)in the capsule is present as etilefrineresinate.. Standard solutions were calculated according to the authentic etilefrineHCl (ETF). So, to convert the etilefrineHCl (ETF) found percentage to etilefrine found per- centage; it is multiplied by the conversion factor of Aliquots of standard ETFsolution in methanol (100 µg ml-1) containing (0.1 – 1) mg of the drug were added to a series of 10 -ml volumetric flasks and then diluted to the mark with methanol The so- lution of drugs were scanned in the range of 200- 400 nm. For Area under Curve method, the sampling wavelength ranges selected for estimation of ETF in presence of CPM are 237-247 nm (ë1-ë2) and 265- 275 nm (ë3-ë4). Mixed standards were prepared and their Area under the Curve were measured at the selected wavelength ranges. Concentration of two drugs in mixed standard and the sample solution were calculated using equation (1) and (2). A1 =á1CET +â1CCH…………... (1) at 237-347 nm. A2 = á2CET + â2CCH……….... (2) at 265-275 nm. Where, á1Andá2are absortivities of ETF at (ë1-ë2) and (ë3-ë4) respectively. â 1 and â2areabsortivities of CPM at (ë1-ë2) and (ë3-ë4) respectively. A1 and A2 are area under curve of mixed stan- dard at (ë1-ë2) and (ë3-ë4) respectively. CETF and CCPM are the concentrations in g/100ml. Analysis of pharmaceutical preparation Procedure The following procedure was followed in the dark(using aluminum foil to cover all flasks). To Analytical Analytical CHEMISTRY Analytical Analytical CHEMISTRY An Indian Journal
Spectrophotometric determination of chromium (III) . 230 ACAIJ, 16(6) 2016 Full Paper Full Paper 0.8323. Etilefrine conversion factor = (Mol. Weight of etilefrine/Mol. Weight of etilefrinHCl= 181.2/217.7 = 0.8323 advantage of the ratio-spectra derivative spectro- photometry is the chance of doing easy measurements in correspondence of peaks so it permits the use of the wavelength of highest value of analytical signals (a maximum or a minimum)[15-17]. Moreover, the pres- ence of a lot of maxima and minima is another ad- vantage by the fact that these wavelengths give an opportunity for the determination of active com- pounds in the presence of other compounds and ex- cipients which possibly interfere the assay. In this method the absorption spectrum of the mixture (ab- sorbance at each wavelength) is divided by the ab- sorption spectrum of a standard solution of one of the components, and the first derivative of the ratio spectrum is obtained. The concentration of the other component is then determined from a calibration graph. RESULTS AND DISCUSSION Spectral characteristics The zero order (D0) absorption spectra of ETF (60 µg ml-1) and CPM (60 µg ml-1) were recorded against methanol as blank over the rangeof 200 – 400 For method A Salinas et al.[14] designed a spectrophotometric method, which is based on the derivation of the ra- tio-spectra for resolving binary mixtures. The main Figure 2 : Zero-order absorption spectra of ETF (60µg ml-1) (¯) and CPM (60 µg ml-1) (…..) in methanol Figure 3 : Ratio spectra of ETF (10 -100µgml-1) using (60 µgml-1) CPM as divisorand methanol as blank Analytical Analytical CHEMISTRY Analytical Analytical CHEMISTRY An Indian Journal
ACAIJ, 16(6) 2016 Ahmed M.Abdelraoof et al. 231 Full Paper Full Paper The main parameters that affect the shape of the ratio spectra were wavelength, scanning speed, the concentration of the standard solution used as a di- visor; the wavelength increment over which the de- rivative was obtained (Äë) and the smoothing func- tion was carefully tested. The ratio spectra presented in Figure(3)and the first derivative of the ratio spec- tra presented in Figure (4)may provide a good proof for this understanding. The effect of wavelength scan- ning speed is studied. It was found that at high speed noisy spectra were obtained while at low scanning speed, the noise was decreased but a longer time was needed for the measurements, so medium scan- ning speed was chosen to perform measurements. Effect of divisor concentration was also tested, dif- ferent concentrations of divisor were used (10,30 and60 µg ml-1) of CPM and the divisor of concen- tration 60 µg ml-1of CPM was found the best regard- ing average recovery percent when it was used for the prediction of ETFconcentrations in bulk powder as well as in laboratory prepared mixtures. The absorption spectra of ETF were divided by the absorption spectrum of 60 µg ml-1CPM an Fig- ure(3) for determination of ETF in the presence of CPM. These gave the best compromise in terms of sensitivity, repeatability and signal to noise ratio. The choice of wavelength for the measurement was carefully studied. The trough amplitude at 274.0 and peak amplitude at 279 nm of the first derivative of ratio spectra are then recorded respectively. Good linearity was observed but the recovery percent at 279.0 nm was better, which may be attributed to its higher signal to noise ratio. For method B Ratio difference18 is a new simple, rapid and selective method for the simultaneous determination of components having overlapping spectra in binary mixtures, having the advantages of minimal data pro- cessing and wider range of application. The binary mixture of ETF and CPM was chosen as an example for the application of the new ratio difference method. The absorption spectra of ETF and CPM show a degree of interference as shown in figure (2), that the application of direct spectrophotometry failed to determine ETF in the presence of CPM. Several approaches have been developed to remove the overlapping constant in the ratio spectrum, either using certain order derivativeor through a sophisti- cated subtraction followed by multiplication proce- dure[19]; the latter was capable of determining only the component with the less extended spectrum in the mixture. The ratio difference method is a simple innovative method was capable of determining ETF in presence of CPM with minimal data processing, high selectivity regardless which component has more extended spectrum. The method comprises two critical steps, the first is the choice of the divisor, and the selected divisor should compromise between minimal noise and maximum sensitivity. Different concentrations of di- visors are used (10, 30 and 60µg ml-1) of CPM and the divisor concentration 60 µg ml-1 was found the best regardingaverage recovery percentwhen it was Figure 4 : First derivative of ratio spectra of ETF (10-100µgml-1)using 60 µgml-1OfCPM as a divisor and methanol as blank Analytical Analytical CHEMISTRY Analytical Analytical CHEMISTRY An Indian Journal
Spectrophotometric determination of chromium (III) . 232 ACAIJ, 16(6) 2016 Full Paper Full Paper used for the prediction of ETF concentration in bulk powder as well as in laboratory prepared mixtures. The second critical step is the choice of the wavelengths at which measurements are recorded. Any two wavelengths can be chosen provided that they exhibit different amplitudes in the ratio spec- trum and a good linearity is present at each wave- length individually. Linear correlation was obtained between the differences in amplitudes at 260.0 and 281.0nm, against the corresponding concentration of ETF. Good linearity is obtained in the concentration range of 10 - 100 µg ml-1ETF. For method C In this method[20], the absorption spectra of the drug were divided by a suitable absorption spec- trum of the interfering drug (divisor) to get the ratio spectra Figure (4). The best divisor concentration was 60 ìg/ml of CPM. The obtained ratio spectra were mean centered using MATLAB and the con- centration of ETF was determined by measuring the amplitude at 283 nm Figure (5) For method D The utility of dual wavelength[21] method is to calculate the unknown concentration of a component of interest present in a mixture containing both the component of interest and an unwanted interfering component by the mechanism of the absorbance dif- ference between two points on the mixture spectra. The calibration curves were prepared at absorbance difference of two wavelengths (269 nm – 244 nm). The response for the ETF was found to be linear in the concentration range 10 to 100 ìg/ml and at ab- Figure 5 : Mean centered ratio spectra of ETF (10 – 100 µg ml-1) using (60 µg ml-1)ofCPM as a divisor and methanol as blank Figure 6 : Zero order absorption spectra of (60 µgml-1) ETF (¯) and(50 µgml-1) CPM (…) showing wavelength ranges for area under curve method using methanol as blank Analytical Analytical CHEMISTRY Analytical Analytical CHEMISTRY An Indian Journal
ACAIJ, 16(6) 2016 Ahmed M.Abdelraoof et al. 233 Full Paper Full Paper calibration graph for the method was constructed by plotting troughheight versus concentration in ìg/ml. The regression plot was found to be linear over the range of 10-100 µg/ml. The linear regression equa- tion for the graph is: P279 nm= 0.0181 C - 0.0079 r = 0.9997 Where C is the concentration of ETF in µg ml-1, P is the trough height of the first derivative of the ratio spectrum curve at 279 nm and ris the correlation coefficient. Method B Linear correlation was obtained between the dif- ferences in amplitudes at 260.0 and 281.0nm, against the corresponding concentration of ETF. Goodlinearity is obtained in the concentration range of 10-100 µg ml-1. The corresponding regression equation was computed to be: P260.0 – 281.0 = 0.117 C - 0.0536 (r = 0.9998) Where P is the amplitude difference at the selected wavelengths, C is the concentration in g ml-1 and r= the correlation coefficient. Method C Linear correlation was obtained between the mean centered values at 283 nm, against the corre- sponding concentration of ETF. Good linearity is obtained in the concentration range of (10 - 100µg ml-1) ETF The corresponding regression equation was computed to be: MCN 283 = 0.0996 C - 0.0452 (r = 0.9997) Where MCN is the peak amplitude of the mean cen- tered ratio spectrum curve, C is the concentration in g ml-1 and r = the correlation coefficient, as shown in TABLE 1. Method D The calibration curves were plotted over a con- centration range of 10-100 ìg/ml for ETF. P244.0 – 269.0 = 0.0069 C - 0.0025 (r = 0.9997) Where P is the amplitude difference at the selected wavelengths, C is the concentration in g ml-1 and r= the correlation coefficient. Method E Under the described experimental conditions, the sorbance difference of two wavelengths (244 nm – 269 nm), the response was found to be linear in the concentration range 10 to 100 ìg/ml. The linearity of the calibration curve was validated by the high values of correlation coefficient, Figure (2). For method E Selection of the wavelength region to construct AUC method has a great effect on the analytical pa- rameters such as slope, intercept and correlation coefûcient. Different wavelength regions are tested where the wavelength ranges 237–247 nm and 265– 275 nm are selected which show good selectivity and percentage recovery, (Figure 6). Area under curve of the absorption spectra in the wavelength ranges 237–247 nm (ë1-ë2) and 265– 275 nm (ë3-ë4) of Etilefrine in the concentration range of 10–100 µg ml-1werecalculated. For chlorophenerminearea under curveof the absorption spectra in the wavelength ranges 237–247 nm(ë1- ë2) and 265–275 nm (ë3-ë4) in the concentration range of 10–100 µg ml-1werealso calculated. The absorptivity ‘Y’ values of Etilefrine and Chlorophenermine were calculated at each wave- length range. The concentrationsof Etilefrinecan be obtained by applying Cramer’s rule and matrices in Eqs. (1) and (2). Concentration of two the drugs in mixed standard and the sample solution are calcu- lated according to the following equations[22-23] A1 =89C ET +834CCH…………...(1) at 237-347 nm. A2 = 781CET + 882C CH………....(2) at 265-275 nm. Where CET and CCH are the concentrations of Etilefrine and Chlorophenermineing/100ml, respec- tively. 89 and 781 are the absorptivity value of Etilefrine at (ë1-ë2) and (ë3-ë4) respectively. 834and 882are absorptivity valueof chlorophenermine at (ë1- ë2) and (ë3-ë4) respectively. A1 and A2 are the area under curve of sample solutions at the wave length range (ë1-ë2) and (ë3-ë4) respectively. VALIDATION OF THE METHODS Linearity Method A Under the described experimental conditions, the Analytical Analytical CHEMISTRY Analytical Analytical CHEMISTRY An Indian Journal
Spectrophotometric determination of chromium (III) . 234 ACAIJ, 16(6) 2016 Full Paper Full Paper TABLE 1 : Spectral data for determination of etilefrine by the proposed methods Mean centering Area Parameters Ratio derivative Ratio difference Dual wavelength Under curve 237-247 265-275 10-100 0.372 1.128 0.0792 0.0889 0.9996 ë max (nm) 279 260-281 283 244-269 Linearity range (µgml-1) LOD (µgml-1) LOQ (µgml-1) Regression equation* Slope (b) Intercept (a) Correlation Coefficient (r) 10-100 0.294 0.893 0.0181 0.0079 0.9997 10-100 1.452 4.40 0.117 0.0536 0.9998 10-100 1.005 3.04 0.0996 0.0452 0.9997 10-100 0.919 2.785 0.0069 0.0025 0.9997 TABLE 2 : Intra-day and inter-days accuracy and precision for the determination of etilefrine by the proposed methods Intra-day Accuracy (R %) 100.39 99.83 99.97 100.30 99.28 100.10 100.46 99.12 99.84 100.24 100.53 99.25 101.61 99.05 98.93 Inter-days Accuracy (R %) 100.17 100.14 99.29 100.22 100.10 99.03 100.48 100.03 99.13 99.75 100.33 101.23 101.05 98.60 99.00 Precision (RSD %) 1.222 1.014 1.882 1.156 1.216 1.551 1.393 1.162 0.779 .836 0.729 1.716 0.415 0.858 0.223 Precision (RSD %) 0.939 1.650 0.620 0.147 1.354 0.829 0.368 1.531 0.658 0.147 1.531 0.144 0.174 0.450 0.162 Conc. g.ml-1 Method Method Method Method Method 50 60 100 50 60 100 50 60 100 10 50 100 50 80 100 A B C D E calibration graph for the method was constructed by plotting area under curve versus concentration in ìg/ ml. The regression plot was found to be linear over the range of 10-100 µg/ml. The linear regression equation for the graph is: PAUC = 0.0792C – 0.0889 (r = 0.9996) WherePAUC is area under curve at the selected wave- lengths, C is the concentration in g ml-1 and r= the correlation coefficient. Sensitivity The limit of detection (LOD) and the limit of quantitation (LOQ) werecalculated according to ICH Q2 Recommendation26from the following equations: LOD = 3.3 Sa / slope LOQ = 10 Sa / slope Where Sa is the standard deviation of the intercept of regression line. LOD was found to be 0.294, 1.452, 1.45, 0.919 and 0.372ìg/ml, while LOQ was found to be 0.893,.4.40, 3.04, 2.785 and 1.128ìg/ ml for method A,B,C,D and E respectively. The small values of LOD and LOQ Accuracy and precision Three replicate determinations of three differ- ent concentrations of ETFin pure form within lin- earity range were performed in the same day (intra- day) and in three successive days (inter-day). Accu- racy as recovery percent (R%) and precision as per- centage relative standard deviation (RSD%) were calculated and results are listed in TABLE 2. The small values of RSD% indicate high precision of the method. Morever, the good R% confirms excel- lent accuracy. Analytical Analytical CHEMISTRY Analytical Analytical CHEMISTRY An Indian Journal
ACAIJ, 16(6) 2016 Ahmed M.Abdelraoof et al. 235 Full Paper Full Paper TABLE 3 : Determination of ETF in Mixtures withCPM by the proposed methods Recovery% of Intact Mean centering 101.24 98.97 100.20 99.30 99.68 99.88±0.891 Intact (µg ml-1) 30 40 50 70 90 Mean ± SD Intact (µg ml-1) 20 30 40 70 80 Mean ± SD 20 30 40 70 80 Degradate (µg ml-1) 9 12 15 21 27 Degradate % Ratio derivative Ratio difference 101.67 98.30 99.60 99.71 99.63 99.78±1.205 Dual wavelength 101.08 98.79 98.73 100.43 100.36 99.88+1.060 23 23 23 23 23 100.90 99.43 100.87 100.39 101.59 100.64±0.797 Degradate (µg ml-1) 6 9 12 21 24 6 9 12 21 24 Degradate % Recovery% of Intact , Area under curve 23 23 23 23 23 23 23 23 23 23 100.31 101.03 99.81 99.68 101.14 100.39 ±0.674 100.31 101.03 99.81 99.68 101.14 TABLE 4 : Determination of ETF in BALKIS® Tablets by the proposed and reported methods Proposed Methods First derivative ratio Ratio Difference Reported*** method[3] Parameters Mean Dual Area centering wave length under curve 5 99.63 0.859 0.862 0.466 (2.306) 1.78 (6.38) 5 5 5 5 5 N* X? SD RSD% 100.26 0.624 0.622 0.562 (2.306) 3.39 (6.38) 99.73 0.582 0.583 0.484 (2.306) 3.89 (6.38) 99.15 0.665 0.670 0.141 (2.306) 2.98 (6.38) 99.41 1.218 1.225 0.339 (2.306) 2.11 (6.38) 98.87 1.23 1.34 —— t** F** —— * No. of experimental; ** The values in the parenthesis are tabulated values of t and F at (p= 0.05); ***The reported method (MBTH) method Specificity The specificity of the proposed methods was assured by applying the laboratory prepared mix- tures of the Etilefrine together with chlorophenermine maleate. The proposed methods were adopted for the specific determination of ETF in presence of up to23 % of CPM as the same ratio in the pharmaceutical preparation (Balkis®capsule). The percentage recovery±SD% was 100.64 ±0.797,99.78±1.205, 99.88±0.891, 99.88±1.060 and100.39±0.674for method A, B, C, D and E re- spectively, as shown in TABLE 3. Pharmaceutical applications The proposed methods were applied to the de- termination of the studied drug in its Tablet prepa- ration. The results were validated by comparison previously reported method[3]. No significant differ- ence was found by applying t-test and F-test at 95% confidence level, indicating good accuracy and pre- cision of the proposed method for the analysis of the studied drug in its pharmaceutical dosage form,as seen in TABLE 4. CONCLUSION The proposed methods are simple, rapid and in- expensive. So, it is good alternative to the other few Analytical Analytical CHEMISTRY Analytical Analytical CHEMISTRY An Indian Journal
Spectrophotometric determination of chromium (III) . 236 ACAIJ, 16(6) 2016 Full Paper Full Paper reported methods and to the high cost HPLC methods. [12] A.S.Christophersen, E.Hovland, K.E.Rasmussen; J.Chromatogr A., 234, 107-20 (1982). [13] A.F.Shoukry, Y.M.Issa, M.S.R.M Rizk El-Nashar; Anal.Lett, 29, 1463-1475 (1996). [14] F.Salinas, J.Nevado, A.Mansilla; Talanta, 37, 347– 351 (1990). [15] A.El-Gindy, A.Ashour, L.Abdel-Fattah, M.Shabana; J.Pharm.Biomed.Anal., 24, 527–534 (2001). [16] J.Lemus, P.Arroyo; J.Anal.Chim.Acta., 437, 247- 257 (2001). [17] R.C.Tena, Delgado, M.J.Sanchez, F.G.Montelongo; Talanta, 44, 673-683 (1997). [18] E.S.Elzanfaly, A.S.Saad, A.E.Abd-Elaleem; Saudi.Pharm.J., 20, 249–253 (2012). [19] M.G.El-Bardicy, H.M.Lotfy, M.A.El-Sayed, M.F.El- Tarras; J.AOAC Int., 91, 299–310 (2008). [20] H.W.Darwish, S.A.Hassan, M.Y.Salem, B.A.El- Zeiny; Spectrochim.Acta Part A, 83,140–148 (2011). [21] G.Bharat; Chaudhari 1, J.Heena.Patel, Inte.J.Pharm.anal., 2, 148-154 (2014). [22] S.L.Prabu, Shirwaikar, C.D.Kumar, A.Joseph, R.Kumar; Indian j.pharm sci., 70, 128-131 (2008). [23] S.S.Chitlange, A.L.Mulla, G.R.Pawbake, S.B.wankhede; Int.J.Pharm.Quality assurance, 2, 31-34 (2010). [24] The british pharmacopoeia, Her majesty’s station- ary office, London, UK, (2009). [25] Egyptian international pharmaceutical industries Co.(EIPICO), Personal Communication, (2012). [26] ICH Q2 (R1); Validation of analytical procedure, Text and methodology, Geneva, International Con- ference on Harmonization, (2005). ACKNOWLEDGMENT The authors thank Department of Pharmaceuti- cal Analytical Chemistry, Faculty of Pharmacy, and Al-Azhar University for supporting this work. REFERENCES [1] The merck index, An encyclopedia of chemicals, Drugs, and Biologicals. 14th Edition, Merck & Co., Inc., Whitehouse station, NJ, USA, (2006). [2] N.W.Beyene, J.F.Van Staden, R.I.Stefan; IlFarmaco., 59, 1005-1010 (2004). [3] G.H.Ragab, M.S.Elmasry, A.A.Aboul-Kheir; Egypt J.Pharm.Sci., 45, 21-32 (2004). [4] R.S.Bakry, A.F.El Walily, S.F.Belal; Anal.Lett., 28, 2503-2519 (1995). [5] M.N.El Bolkiny, S.Hana, M.M.El-Henawee, M.M.Ayad; Egyptian J.Pharm.Sci., 33, 31-42 (1992). [6] A.M.Mohsen, A.M.Badawey, M.A.Shehata, S.Z.Elkhateeb; Int.J.Pharm.Sci., 6, 595-603 (2014). [7] R.S.Bakry, A.F.M.ElWalily, S.F.Belal; Mikrochim Acta, 127, 89-93 (1997). [8] A.E.El-Gendy; Anal.Lett., 33, 2927-2938 (2000). [9] F.AAly, S.A.Tamimi, A.A.Alwarthan; j.Aoac.Int., 83, 1299–1305 (2000). [10] K.Kojima, M.Yamanaka, Y.Nakanishi, S.Arakawa; J.Chromatogr.Biomed.Sci.and App., 525, 210-217 (1990). [11] B.D.Ahrens, B.Starcevic, A.W.Butch; Methods Mol.Biol., 902, 115–128 (2012). Analytical Analytical CHEMISTRY Analytical Analytical CHEMISTRY An Indian Journal