Download
1 / 8
80 likes | 99 Views
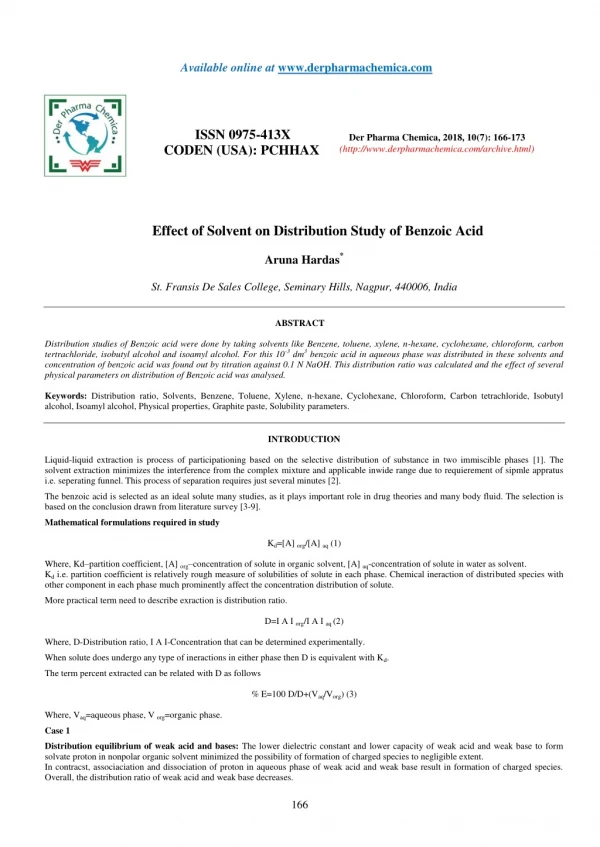
Distribution studies of Benzoic acid were done by taking solvents like Benzene, toluene, xylene, n-hexane, cyclohexane, chloroform, carbon<br>tertrachloride, isobutyl alcohol and isoamyl alcohol. For this 10-3<br>dm3<br>benzoic acid in aqueous phase was distributed in these solvents and<br>concentration of benzoic acid was found out by titration against 0.1 N NaOH. This distribution ratio was calculated and the effect of several<br>physical parameters on distribution of Benzoic acid was analysed.<br>

E N D
Available online at www.derpharmachemica.com ISSN 0975-413X CODEN (USA): PCHHAX Der Pharma Chemica, 2018, 10(7): 166-173 (http://www.derpharmachemica.com/archive.html) Effect of Solvent on Distribution Study of Benzoic Acid Aruna Hardas* St. Fransis De Sales College, Seminary Hills, Nagpur, 440006, India ABSTRACT Distribution studies of Benzoic acid were done by taking solvents like Benzene, toluene, xylene, n-hexane, cyclohexane, chloroform, carbon tertrachloride, isobutyl alcohol and isoamyl alcohol. For this 10-3 dm3 benzoic acid in aqueous phase was distributed in these solvents and concentration of benzoic acid was found out by titration against 0.1 N NaOH. This distribution ratio was calculated and the effect of several physical parameters on distribution of Benzoic acid was analysed. Keywords: Distribution ratio, Solvents, Benzene, Toluene, Xylene, n-hexane, Cyclohexane, Chloroform, Carbon tetrachloride, Isobutyl alcohol, Isoamyl alcohol, Physical properties, Graphite paste, Solubility parameters. INTRODUCTION Liquid-liquid extraction is process of participationing based on the selective distribution of substance in two immiscible phases [1]. The solvent extraction minimizes the interference from the complex mixture and applicable inwide range due to requierement of sipmle appratus i.e. seperating funnel. This process of separation requires just several minutes [2]. The benzoic acid is selected as an ideal solute many studies, as it plays important role in drug theories and many body fluid. The selection is based on the conclusion drawn from literature survey [3-9]. Mathematical formulations required in study Kd=[A] org/[A] aq (1) Where, Kd–partition coefficient, [A] org–concentration of solute in organic solvent, [A] aq-concentration of solute in water as solvent. Kd i.e. partition coefficient is relatively rough measure of solubilities of solute in each phase. Chemical ineraction of distributed species with other component in each phase much prominently affect the concentration distribution of solute. More practical term need to describe exraction is distribution ratio. D=Ι A Ι org/Ι A Ι aq (2) Where, D-Distribution ratio, Ι A Ι-Concentration that can be determined experimentally. When solute does undergo any type of ineractions in either phase then D is equivalent with Kd. The term percent extracted can be related with D as follows % E=100 D/D+(Vaq/Vorg) (3) Where, Vaq=aqueous phase, V org=organic phase. Case 1 Distribution equilibrium of weak acid and bases: The lower dielectric constant and lower capacity of weak acid and weak base to form solvate proton in nonpolar organic solvent minimized the possibility of formation of charged species to negligible extent. In contracst, associaciation and dissociation of proton in aqueous phase of weak acid and weak base result in formation of charged species. Overall, the distribution ratio of weak acid and weak base decreases. 166
Der Pharma Chemica, 2018, 10(7): 166-173 Aruna Hardas In perticular when, we consider case of benzoic acid which is weak monobasic acid. The dissocaiation takes place as follows. If HA is weak acid then, HA + - H +A (4) Ka1=[ H+ ] [A- ]/[HA] If no any further dissociation exist then Ka1 is Ka. For the distribution of undissociated species, HA HA org Kd =[HA] org /[HA] aq (5) When, dissociation in organic phase is negligible the distribution ratio of acid is D=[HA] org/[HA]+[A- ] =Kd/1+Ka [H+]-1 (6) In terms of Mole Units MHA=[HA] org Vorg+[HA] V+[A- ] V (7) Where, MHA –amount acid in mole Unit, V- total volume of two phase, Vorg–Volume of organic solvent When, volume of two phases are equal, MHA/V is equals to concentration of acid in the one phase to which acid was initially added. MATERIALS AND METHODS Experimental Organic solvents perticularly, Benzene, toluene, xylene, n-hexane, cyclohexane, cyclohexanone, chloroform, carbon tetrachloride, isobutyl alcohol and isoamyl alcohol were used and purified by using usual procedures, [10]. Water was distilled using jacket and copper heating elements [10]. A standard 0.1 M solution of oxalic acid was prepared by dissolving 0.63 g of oxalic acid in distilled water and making the volume to 10 ml. The standard oxalic acid solutionwas prepared for standardization of sodium hydroxide solution. A stock solution of standard 0.1 M was prepared by dissolving 4 g of sodium hydroxide in 1 dm3 distilled water. At the time of experiment 0.01 ml of stock solution was diluted 10 times. A stock solution of benzoic acid was of 0.01M standard was prepared by dissolving 1.22 g of benzoic acid in hot distilled water to make up a volume of 1 dm3. A graphite pastewas prepared by physical mixing of graphite powder with organic solvent in 60: 40 ratio by weight. Distribution studies Extraction and determination: 10-2 dm3 of benzoic acid solution in aqeous phase and variable amount of organic solvent or carbon paste or combination of there of was taken in 10 differnt stoppered bottles of 6 x 10⁻² dm3 capacity. The bottles were stoppered tightly and shaken vigorously on Gansons shaking machine for different time durations. The technique of pahse separation by separatory funnel was used. The concentration of acid in both the phases were estimated by titration method. The 0.1 N NaOH ans phenolphthalein indicator were used for titration. At the end point colour change from colourless to pink was observed. The blank titration was performed in order to stadadize the experimental values. The estimation of acid concentration in organic phase was also carried out in similar way. The only difference is about rappid stirring. When difficulties in titration method arises, the concentration of acid was determined using analyte concentration in aqueous phase and difference method. The distribution ratio was calculated using equation (2) Determination of impuritie The acidic impurities can be calculated by comparing the titratnt value againd the blank titration. For basic impurities excess of benzoic acid was added and back titration was carried out. The reported solubilities in mole fraction was converted into moles per dm3 for comparision purpose. The mole fraction is given as follows, F=a/(a+b) (8) Where, a=moles of solute, b=moles of solvent. The value of moles of solvent can be calculated as follows b=1000-wt of solute/molecular weight of solvent 167
Der Pharma Chemica, 2018, 10(7): 166-173 b=(1000-a*M1)/M2 (9) Aruna Hardas where, M1=molecular weight of solute, M2=molecular weight of solvent The obtained value of ‘a’ can be converted in the solubility in terms of mole/dm3 as follows X cal=1000*a/[b*(M2/D2)] (10) Calculations for distribution ratio and %E based on Xcal Distribution ratio was determined as follows D cal=Xcal (org)/Xcal(aq) (11) Calculated extraction (%E cal) can be calculated as follows %E cal= 100*Dcal/[Dcal + (Vaq/Vo)] (12) The maximum extraction of benzoic acid can be calculated as %E max =100*KD/[KD + (Vaq/Vo)] (13) Reproducibility of data was examined several times. RESULTS AND DISCUSSION Feasibility of extraction of benzoic acid in organic solvent was studied. The effect of several physical parameters on distribution of benzoic acid was analysed. The extractibility of benzoic acid on several organicsolvents were tested. The concentration of benzoic acid used for this test was 10-2 moles/dm3. The volume of water and organic solvent was 20 ml. The organic solvents are namely; benzene, Toluene, xylene, n-hexane, cyclohexane, cyclohexanone, chloroform, carbon tetrachloride, isobutyl alcohol, isoasoamyl alcohol, Diethylether and Nitrobenzene. For the first instance and complete extraction of benzoic acid, the time of extraction was kept 15 min. In this study excellent extractibility of benzoic acid was observed for chloroform and Isobutyl alcohol which is above 80%. The extractibility of benzoic acid in the range of 40 to 60% are considered as good and the solvents benzene, Toluene, xylene, n-hexane, cyclohexane, cyclohexanone, carbon tetrachloride, isoasoamyl alcohol belongs to these group. Rest of the solvents diethyl ether and nitrobenzene have poor extractibility of benzoic acid. For the further studies the solvents having extractibility of benzoic acid above 40% were selected irrespective of their miscibility in water. Furthermore, effect of time on extraction was deduced by carying out the experiments at several time intervals. The concentration of benzoic acid used under testing was 1.045 × 10⁻² Mole/dm3. The organic solvent used for this test was chloroform as it have excellent extraction of benzoic acid as deduced in last exercise. Equal volume of both aqueous and organic phase with total volume of 2 × 10⁻² dm3was employed for analysis. Table 1provides the behaviour of benzoic acid extraction with respect to agitation time. After time of 7 min the extraction of benzoic acid attained the uniform behaviour i.e. 80.2% of extarction. From this studies and for sake of simplicity the time of 10 min was selected for further studies. Table 1: The effect of time on extraction of benzoic acid Time of agitation (min) moles/dm3 1 1 8.384 Caq × 1000 Corg × 1000 moles/dm3 2.0693 S. No. D=Corg/Caq %E 0.24 19.79566 2 3 6.288 4.192 0.66 40 3 5 4.192 6.288 1.5 60 4 7 2.0693 8.384 4.05 80.20434 5 10 2.0693 8.384 4.05 80.20434 6 15 2.0693 8.384 4.05 80.20434 7 8 20 30 2.0693 2.0693 8.384 8.384 4.05 4.05 80.20434 80.20434 Volume of aqueous phase=Volume of aqueous phase=10-2 dm3 Total concentration of benzoic acid=1.045 × 10⁻² Mole/dm3 Next to this, experiment on optimization of the maximum extractable concentration of benzoic acid was carried out. The combination of aqueous phase and chloroform as solvent was kept as it is with the same conditions as used in previous exercise. The time of agitation was 10 min. The concentration of NaOH used in this study was 1.08 × 10⁻² Moles/dm3. The least count of burette used in this study was 5 × 10⁻² dm3. Table 2 gives the effect on extarction with the change concentration of benzoic acid. It can be deduced that variation in concentration of benzoic acid does not affect extraction. However, higher concentration of benzoic acid will result into higher degree of association therefore, 10-2 Moles/dm3 was otimized for further studies. Table 2: Optimization of benzoic acid concentration in chloroform water system 168
Der Pharma Chemica, 2018, 10(7): 166-173 Aruna Hardas Conc. of benzoic acid 1000 × moles/dm3 1 Range of extraction (%) 66.7-88 Titre volume (aq) mdm3 Titre volume (org) mdm3 S. No. 1 0.1 0.35 2 2 0.15 0.75 77.78-89 3 3 0.3 0.9 71.0-79 4 4 0.4 1.6 75.5-82.6 5 5 0.45 1.95 79.2-83.3 6 6 0.5 2.4 81.1-84.5 7 7 0.55 2.85 82.4-85.3 8 8 0.6 3.35 83.6-86.1 9 9 0.7 3.85 83.0-85.7 10 10 0.85 4.3 82.6-84.6 Volume of aqueous phase=Volume of aqueous phase=10-2 dm3 Total concentration of benzoic acid=1.045 × 10⁻² Mole/dm3 Concentration of NaOH=1.08 × 10⁻² Mole/dm3 The present study was carried out without prior adujustment of pH in order to avoid complications and interference of other ions. However, it is calculated by using following equation. Log [(KD-D)/D]=pH + log Ka1 (14) Ka1=[H+ ] 2/[HA] (15) Distibution study of benzoic acid After optimization of physical parameters for extraction of benzoic acid, distribution studies were carried out. A system containing 10-2 Moles/dm3 of benzoic acid in 10-2 dm3 of water was agitated with 10-2 dm3 of organic solvent for 10 min. The phases were separated after equilibrium. Organicand aqueous phases were titrated agains sodium hydroxide solution using phenolphthalein indicator. In addition to this study on semisolid liquid extraction was also carried out. In these studies graphite paste was used in addition to water-organic solvent combination. The information obtained from such type of studies are useful in electrochemical work point of view. In case of graphite use, extraction and adsorption works simultaneously. Present study was focused on extraction. A blank experiment was performed by agitating graphite poweder with water phase without benzoic acid. The experiment was carried out to deduce acidic and basic impurities if present. It was observed that neither acidic nor basic matter out of experiment was obtained. Another blank experiment i.e. extraction of benzoic acid for dry graphite powder without organic solvent was caaried out. The concentration of benzoic acid used for this study was 1.302 × 10⁻² g. The amount of graphite powder used for this study is 0.5 g and volume of water is 10-2 dm3. Distribution studies of benzoic acid in water –organic solvent were carried out seperately. Seven organic solvents used for study are sequencially benzene, toluene, n-hexane, cyclohexane, chloroform, carbon tetrachloride and isobutyl alcohol. The distribution ratio (D) of benzoic acid by using titre volume was calculated for every system as described in above section. Eventhough the pH of any system was not pre-adujusted, it was calculated from the equation. It was observed that for every system pH was in the range of 3.09 to 3.70. Figure 1. represents the data obtaibed from distribution studies of benzoic acid. From figure it is aprent that percentage of extraction (%E) of benzoic acid increases with the increase in its distribution ratio. The curve fits better into the logarithmic trend line. For clear understanding, a bar chartin Figure 2. Is plotted between extractibility of benzoic acid and respective systems. Figure 1: Variation of %E with D 169
Der Pharma Chemica, 2018, 10(7): 166-173 Aruna Hardas Figure 2: Extractability of benzoic acid in different organic solvents The %E follows the following trend Isobutyl alcohol>Chloroform>Toluene=Benzene>Carbon Tetrachloride>n-hexane>Cyclohexane Some unexpected results were obtained due to the presence of acidic or basic impurities. The presence of such impurities led to unexpected high or low titre values. The total content of impurities in the solvent after usual process of purification were determined by titrimetry. Ther distribution between water and solvent was also studied, i.e. blank experiment was performed. According to our observations, acidic impurities were present in the Isoamyl alcohol. The order of these impurities was 6.93 × 10⁻³ M/dm3. The presence of basic impurities was observed in n- hexane, which is of order 6.3 × 10⁻⁴ M/dm3. The data represented in this paper is the processed data after such corrections. Furthermore, we could able to co-relate %E with dielectric constant and viscocity of organic solvents used in the systems as shown in the Table 3. The increase in dielectric constant increases the extraction in polar solvents. More dissocication of benzoic acid in polar solvents and in contrast, more association was observded in non-polar solvents. Table 3: variation of %E with dielectric constant, boiling point and viscosity of organic solvents used in system S. No. Solvents Dielectric constant Viscosity Boiling Point (ºC) %E 1 Benzene 2.28 0.6487 80 75.49 2 Toluene 2.4 0.5866 110 76.37 3 n-hexane 1.9 0.3126 68 58.54 4 cyclohexane 2 0.98 80.74 44.07 5 Chloroform 2.24 0.965 61 83.47 6 carbon tetrachloride 2.24 0.965 76 66.71 7 isobutyl alcohol 15.8 3.9 108 92.83 Conversion of solubility parameter to molar solubilities The solubility parameter obtained from four parametres solubility approach system are in mole fraction (X2.cal). The values were converted to the molar solubility Xcal using equations 4-9and are reported in Table 4. The distribution ratio for 7 selected solvents were calculated from equation 11, which is reported as Dcal. Silmilarally, calculated values of %E is reported in Table 5. The values in Table 6 are based upon the solubility parameter of the individual system in which the effect of mutula solubilitied are not considered. Table 4: Solubility parameters X2.cal x 10-2 (Mole fraction) Xcal S. No. Solvent a b M2 d2 (moles/dm3) 1 Benzene 4.59 0.5735 11.92 78 0.879 0.5421 170
Der Pharma Chemica, 2018, 10(7): 166-173 Aruna Hardas 2 Toluene 7.07 0.75 9.87 92 0.867 0.713 3 n-hexane 0.45 0.052 11.55 86 0.659 0.034 4 Cyclohexane 2.2 0.259 11.52 84 0.779 0.2084 5 Chloroform 21.89 1.877 6.5278 119 1.49 3.59 6 Carbon tetrachloride 3.52 0.2302 6.311 154 1.49 0.353 7 Isobutyl Alcohol 13.25 1.648 10.79 74.12 0.801 1.1717 8 Water 0.07 0.0389 55.55 18 1 0.0389 Table 5: Solubility parameters X2.cal x 10-2 (Mole fraction) 4.59 Xcal S. No. Solvent a b M2 d2 (moles/dm3) 0.5421 1 Benzene 0.5735 11.92 78 0.879 2 Toluene 7.07 0.75 9.87 92 0.867 0.713 3 n-hexane 0.45 0.052 11.55 86 0.659 0.034 4 Cyclohexane 2.2 0.259 11.52 84 0.779 0.2084 5 Chloroform 21.89 1.877 6.5278 119 1.49 3.59 6 Carbon tetrachloride 3.52 0.2302 6.311 154 1.49 0.353 7 Isobutyl Alcohol 13.25 1.648 10.79 74.12 0.801 1.1717 8 Water 0.07 0.0389 55.55 18 1 0.0389 The trend observed in extractibility on the basis of calculation is as follows, Chloroform>isobutyl Alcohol>Toluene>benzene>Cyclohexane>Carbon Tetrachloride>n-hexane. In order to determine the maximum possible extractibility of the benzoic acid in the organic solvents various experiments were performed. The solubility of benzoic acid in water is 2.59 × 10⁻² M/dm3 at the ambient temperature. The distribution ratio (D sat) was calculated. The Table 6 compiles the distribution ratio and %E based on experimental, saturated condition of benzoic acid and theoretical values. Table 6: Compilation of distribution ratio %E obtained by experimental, calculation and in saturated concentration S. No. Solvent D %E Dsat %E Dcal %Ecal 1 Benzene 3.49 75.49 5.12 83.67 13.935 93.3 2 Toluene 3.16 76.37 4.76 82.65 18.829 94.82 3 n-hexane 1.41 58.54 1.95 66.17 0.874 46.63 4 Cyclohexane 0.79 44.07 5.55 84.74 5.4842 84.57 5 Chloroform 5.05 83.47 9.9 90.83 92.28 98.92 6 Carbon tetrachloride 2 66.71 3.95 79.79 9.07 90.06 7 Isobutyl Alcohol 13.06 92.83 31.69 96.94 30.12 96.76 From Table 6 it is clear that there the obtained values are in good co-ordination with calculated data. The co-relation coeficient are found to be 1.428 for % Ecal vs %E sat and 1.40 for %Ecal vs %E. The deviation in values of n hexane is higher due to uncertainity associated with solubility parameters of benzoic acid. Eventhough mutual solubilities of solvents seems to be lower in percentage, the molar solubility is still higher which affects the distribution ratio. The mutual solubilities of solvents are reported in Table 7. Table 7: Mutual solubility of solvents in water S. No. Solvents Mutual solubility 1 Benzene 0.17 2 Toluene 0.05 3 n-hexane 0.00095 4 Cyclohexane 0.01 5 Chloroform 0.71 6 Carbon tetrachloride 0.081 7 Isobutyl Alcohol - Selection of benzoic acid as an ideal model for study of distribution of drugs in body fluid. Benzoic acid dissociates in water to give benzoate 171
Der Pharma Chemica, 2018, 10(7): 166-173 Aruna Hardas andhydrogen ion. Furthermore predominant association in non polar solvents complicates the matter of dissociation. In such cases one should draw the inference based on distribution constant (KD) and not on distribution ratio. By using the values of KD, KDsat and KDcal the values of respective %E was estimated and repoeted in Table 8. The maximum practicle extractibility can be calculated from the data on solubilitry parameter with greater certainity. Table 8: compilation of %E, %Esat, %Ecal obtained from various sources S. No. Solvent %E %Esat %Ecal 1 Benzene 78 85.27 93.9 2 Toluene 78.54 84.27 94.82 3 n-hexane 66.77 68.13 46.76 4 Cyclohexane 46.52 86.3 84.59 5 Chloroform 85.83 92.1 98.92 6 Carbon tetrachloride 69.6 81.5 90.07 7 Isobutyl Alcohol 94.61 97.67 96.78 Part –II Semisolid liquid extraction The distribution study of benzoic acid with graphite paste is carried out in the second part. This type of study is useful in the electrochemical work wherein the graphite paste electrodes are used as sensors. In case of graphite thephenomenon of extraction and adsorption workssimultaneously. In the prsent work study is focused on extraction. Some blank experiments were carried out in order to determine the behaviour of graphite towrds the experimental parameters. In the first part dry graphite powder without organic solvent was used. In this case bebenzoic acid was allowed to distribute between water and graphite. The %E for this study was found to be 30.91. Which suggests that 30.91% of benzoic acid is removed by graphite powder. In the second experiment dry graphite powder was agitated with only distilled water without benzoic acid. The study of semisolid liquid extraction follows the same method as carried out in liquid-liquid extraction. 0.05 g of graphite paste and 10 ml water is agitated for ten min. The seperation is carried out by centrifugation. The aqueous phase was titrated to estimated the benzoic acid concentration distributed in aqueous phase. The concentration of benzoic acid in graphite (moisted with organic solvent) was calculated by the principle of conservation of mass. All the necessary parameters for the extraction studies were calculated and distribution study was obtained. Table 9 includes the data of extraction of benzoic acid by moisted graphite paste with benzene, toluene, n-hexane, cyclohexane, chloroform, carbon tetrachloride and isobutyl alcohol. Table 9: %E of benzoic acid in organic solvent moist graphite –water system S. No. Solvent %E D Viscosity Boiling point 1 Benzene 10.45 30.58 0.6487 80 2 Toluene 11.42 32.42 0.5866 110 4 n-hexane 11.37 28.5 0.3126 67 5 cyclohexane 15.28 35.14 0.98 81 7 Chloroform carbon tetrachloride isobutyl alcohol 10.77 24.71 0.563 61 8 11.2 25.94 0.965 108 9 12.5 28.75 3.9 131 Generally, the graphite powder functions totally on adsorptive principle but when paste of graphite is made with organic solvent itsadsorptive surface is blocked and works with the phenomenon of extraction. The extraction rate is proportional to the viscocity of solvent. CONCLUSION The present work esimates the role of physical parameter in the distribution processes. Theconversion of solubility parameters to solubility in mole per dm3 and theoretical value of distribution ratio was calculated. The relative extractibilities of different organic solvent with respect to benzoic acid was analysed. The present study also discussed the effect of different organic solvents on distribution benzoic acid. Some empirical trends about moisted graphite with organic solvents–water system was also examined. The effect of different solvents was also observed when distribution of benzoic acid was carried out on graphite with organic solvents–water system. REFERRENCES [1] N.N. Hidayah, S.Z. Abidin, Minerals Engineering, 2017, 112, 103-111. [2] M.G. Bogdanov, I. Svinyarov, Separation and Purification Technology, 2018, 196, 57-60. [3] A. Berthod, N. Mekaoui, J. Chromatogr. A., 2011, 1218(36), 6024-6030. 172
Der Pharma Chemica, 2018, 10(7): 166-173 Aruna Hardas [4] Y.D. Gaetano, J. Hubert, A. Mohamadou, S. Boudesocque, Laurent Dupont Chemical Engineering Journal, 2016, 285, 596-604. [5] G. Muthuraman, T.T.Teng, C.P. Leh, I. Norli, J. Hazard. Mat., 2009, 163(1), 363-369. [6] I. Techakriengkrai, R. Surakarnkul, J. Food Compos. Anal., 2007, 20(3-4), 220-225. [7] S. Shi, D. Fan, H. Xiang, H. Li, Food Chem., 2017, 237, 198-204. [8] X. Shi, L. Qiao, G. Xu, J. Chromatogr. A., 2015, 1420, 1-15. [9] C.C. XU, B. WANG, Y.Q. PU, J.S. TAO, T. ZHANG,Chin. J. Nat. Med., 2017, 15(10), 721-731. [10] M. Berthelot, J. Jungfleisch, Am. Chim et Phys., 1872, 26, 396. 173