Download
1 / 19
190 likes | 338 Views
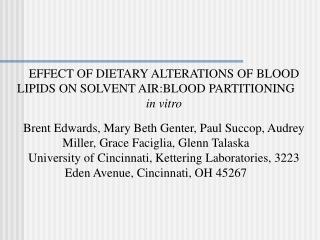
EFFECT OF DIETARY ALTERATIONS OF BLOOD LIPIDS ON SOLVENT AIR:BLOOD PARTITIONING in vitro Brent Edwards, Mary Beth Genter, Paul Succop, Audrey Miller, Grace Faciglia, Glenn Talaska University of Cincinnati, Kettering Laboratories, 3223 Eden Avenue, Cincinnati, OH 45267. Introduction.

E N D
EFFECT OF DIETARY ALTERATIONS OF BLOOD LIPIDS ON SOLVENT AIR:BLOOD PARTITIONING in vitro Brent Edwards, Mary Beth Genter, Paul Succop, Audrey Miller, Grace Faciglia, Glenn Talaska University of Cincinnati, Kettering Laboratories, 3223 Eden Avenue, Cincinnati, OH 45267
Introduction • There is wide individual variation in response to organic solvent exposure • Factors that contribute to this variability include metabolic differences, use of PPE, but other factors are largely unknown • Hypothesis: eating higher fat content meals increases blood lipid levels and results in greater absorption of lipophilic organic solvents
Objectives • Investigate the relationship between in vivo blood lipid levels and in vitro blood-solvent levels. • Determine headspace concentration differences between baseline (before meal) and postprandial (after meal) blood samples for both low and high fat content meals. • Determine the relationship between blood lipid levels (triglycerides) and solvent retention in theblood usinglinear regression.
Methods • Blood was drawn from 11 male and 9 female subjects on 4 separate occasions, before and after low or high fat meals. • A fasting blood sample was taken each day as the baseline for the blood sample taken 4 to 5 hours after the meal was consumed. • Three solvents, methanol (O:W PC. 0.2), isobutanol (7), and chloroform (93), were introduced in vitro to 1 ml aliquots of whole blood and allowed to equilibrate at 98.6 degrees F for five minutes. • Solvent concentrations were measured in the headspace using a Hewlett Packard 5890 series II gas chromatograph equipped with a flame ionization detector (FID).
Figure 4. Triglyceride means * * Pre- vs. Post High Fat Post- Low vs. Post High Fat Pre- vs. Post Low Fat *Denotes statistical significance (α=0.05)
Relationship Between Blood Triglycerides and Headspace Methanol Concentrations A A A A A A A A A A A A 5.50 A A A A A A A A A A A A A A A A A A A A A A A A A A A A A A A A A A A A A A A A A A A A A A A Log (ng/uL methanol) A A A A A 5.00 A A A A A A A A A A A r=0.231 n=80 P=0.039 A A 4.50 A A A 1.60 1.80 2.00 2.20 2.40 Log (triglycerides mg/dL)
Relationship Between Blood Triglycerides and Headspace Isobutanol Concentrations A A A A 2.50 A A A A A A A A A A A A A A A A A A A A A A A A A A A A A A A A A A A A A A Log (ng/uL isobutaol) 2.00 A A A A A A A A A A A A A A A A A A A A r = 0.237 n = 80 p= 0.039 A A A A A A A A A A A A A 1.50 A 1.00 1.60 1.80 2.00 2.20 2.40 Log (triglycerides mg/dL)
Relationship Between Blood Triglycerides and Headspace Chloroform Concentrations 3.50 A A A A A A A A A A A A A A A A A A A A A A A A A A A A A A A A A A A A A A A 3.00 A A A A A Log (ng/uL chloroform) A A A A A A A A A A A A A A A A r= - 0.30 n=80 P=0.007 A A A A A A A A A A A A A A A A A A 2.50 A A 1.60 1.80 2.00 2.20 2.40 Log (triglycerides mg/dL)
Figure 5. Solvent concentrations * * Denotes statistical significance (α=0.05)
RESULT SUMMARY • Average blood triglyceride levels increased from 117.3 to 119.7, and 80.1 to 160.3 mg/dL for low and high fat meals, respectively. • Results statistically significant at the 0.05 level for postprandial samples from low fat meal versus high fat meal. • Significant difference was seen when comparing pre- vs. postprandial samples for the high fat meal (paired t-test, p=0.045). • Headspace chloroform concentrations decreased significantly as blood lipid levels increased (r = -0.30; p=0.007). • Headspace isobutanol and methanol concentrations slightly increased as blood lipid levels increased. These correlations were significant at the α=0.05 level (methanol r=0.231; p=0.039, isobutanol r=0.237; p=0.039). • Average headspace chloroform concentrations decreased when individuals consumed the high fat versus the low fat meal (p=0.001). • There was no significant correlation at the α=0.05 level between blood lipid levels and methanol or isobutanol, respectively. • Headspace chloroform concentrations decreased significantly in post- vs. pre-prandial samples with the high fat meal (p= 0.045).
Conclusions • High fat content meals contribute to increased levels of blood triglycerides 4-5 hours after the meal is consumed. • Increases in blood triglyceride levels from consuming high fat content meals may increase the blood concentration of lipophilic, but not hydrophilic, solvents by the blood. • Data suggests that diet may contribute to uptake of a lipophilic solvent and may influence solvent-related effects. Effect of blood lipids on absorption of compounds with O:W > 100 (e.g., PAH (>100,000)) may be very important
Acknowledgements • This research was supported (in part) by a pilot project research training grant from the University of Cincinnati through its Education and Research Center supported by Training Grant No. T42/CCT510420 from the Centers for Disease Control and Prevention / National Institute for Occupational Safety and Health. The contents are solely the responsibility of the authors and don not necessarily represent the official views of the National Institute for Occupational Safety and Health. • Special thanks to The University of Cincinnati Occupational Health Center for the use of their facilities and help with coordinating blood draws. • Shuann (GC) Lee • Dawn Ramsy (NIOSH Research Chemist) • Dr. Burroughs • Brenda Schumann • Noreen Johnson • Karen Brackemeyer
Special Thanks • Zach Fahrni • Melissa Finley • Jessica Gordon • Susan Kotowski • Taekhee Lee • Brian Meier • Todd Niemeier • Preethi Rao • Jess Wolfgang • Seung-Hyng Cho Jeff a.k.a. "The Wizard of Draws" Bucchino
Headspace solvent concentrations were measured using a Hewlett Packard 5890 Series II gas chromatograph equipped with a flame ionization detector (FID). Split sample injection was used at a split ratio of 10:1. Nitrogen was the carrier gas at a flow rate of 10mL/min through a DB-WAX 0.45 millimeter diameter column. Oven temperature, injector and detector were maintained at 2000 degrees C. GC Conditions
Figure 6. Solvent concentrations * * Denotes statistical significance (α=0.05)