Understanding Candlestick Patterns
This blog explains candlestick patterns u2014 simple visual tools that show price movements in charts. By learning these patterns, traders can understand market trends, spot potential reversals, and make better decisions on when to buy or sell.


Understanding Candlestick Patterns
E N D
Presentation Transcript
Read blog - https://navia.co.in/blog/candlestick-patterns-simple-guide-for-traders/ Understanding Candlestick Patterns
Introduction to Candlestick Patterns Read blog - https://navia.co.in/blog/candlestick-patterns-simple-guide-for-traders/ • Candlestick patterns are popular tools in technical analysis. • They help traders predict price movements based on visual chart patterns. • If you're new to trading — don’t worry! These patterns may look complex, but they're easy to learn with practice. • They’re used by traders around the world to decide when to buy or sell.
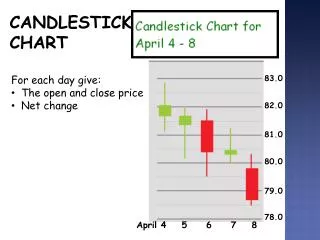
What Is a Candlestick? Read blog - https://navia.co.in/blog/candlestick-patterns-simple-guide-for-traders/ • A candlestick represents price movement over a set time (like 1 min, 1 hr, or 1 day). Each candlestick shows 4 key data points: • Open – Price at the start • Close – Price at the end • High – Highest price • Low – Lowest price • Bullish candle: Close > Open → Price went up • Bearish candle: Close < Open → Price went down
Components of a Candlestick Read blog - https://navia.co.in/blog/candlestick-patterns-simple-guide-for-traders/ • Body – Range between the Open and Close • Wicks/Shadows – Lines above and below the body • These show the High and Low prices during that period. • Candlestick size and shape help traders read market sentiment. • Long wick = price tested a level but reversed • Short body = indecision in market
Why Candlestick Patterns Matter Read blog - https://navia.co.in/blog/candlestick-patterns-simple-guide-for-traders/ • They help identify market trends and turning points • Patterns signal when to enter or exit a trade • Improve your timing and decision-making Examples of signals: • Bullish patterns → Buy opportunity • Bearish patterns → Sell or short opportunity • Learning to read candlesticks gives you a strategic edge in trading!
Disclaimer Investment in securities market are subject to market risks, read all the related documents carefully before investing. The securities quoted are for illustrative purposes and are not intended as recommendations. Brokerage will not exceed the SEBI prescribed limit. Navia Markets Ltd ,SEBI Registration No.INZ000095034-NSE Member code for CM, FAO & CD: 07708 - BSE Clearing No. for CM, FAO & CD: 6341-MCX Member ID: 45345 NSDL DP ID: IN300378-CDSL DP ID: 12086500-SEBI Registration No. for DP: IN-DP-311-2017-GST Registration number :33AAACM4739R2ZZ-Registered office: Ganga Griha, 4th & 5th Floor, No.9, Nungambakkam High Road, Chennai - 600 034 Email ID: ig@navia.co.in - Contact No: +91 70100 75500 https://bit.ly/naviadisclaimer Read blog - https://navia.co.in/blog/candlestick-patterns-simple-guide-for-traders/


![READ [PDF] DON'T TRADE BEFORE LEARNING THESE 14 CANDLESTICK PATTERNS: These 14 most](https://cdn7.slideserve.com/12570745/slide1-dt.jpg)