Download

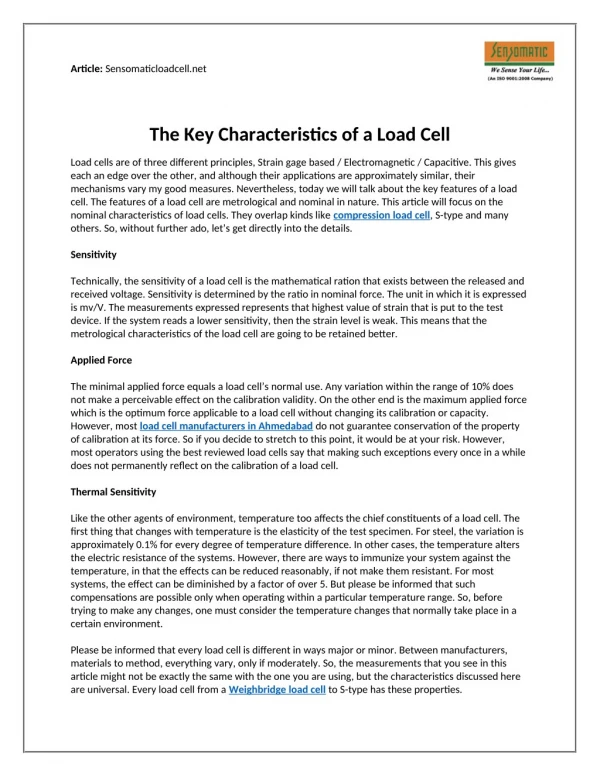
1 / 6
0 likes | 2 Views
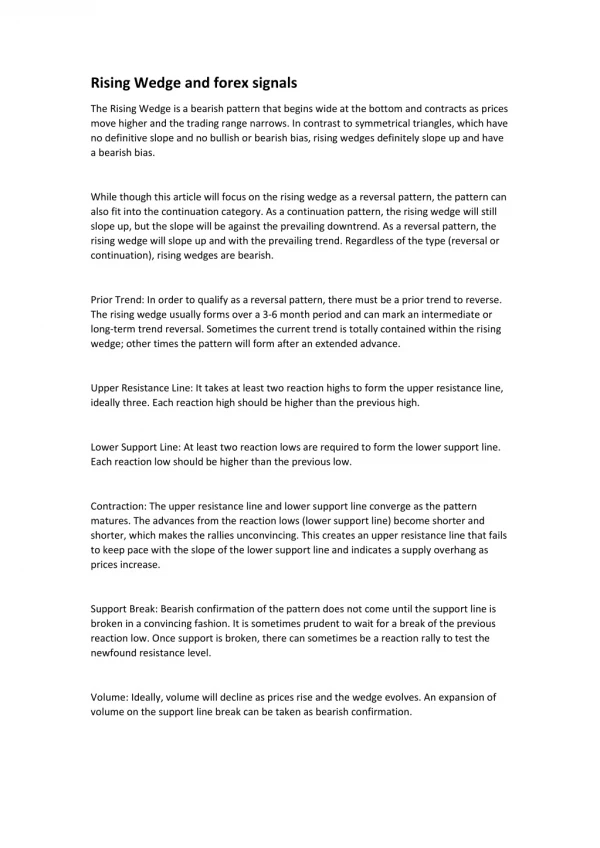
The rising wedge pattern is a bearish chart formation marked by upward-sloping, converging trendlines. It typically forms after an uptrend and signals a potential reversal as buying momentum weakens. Volume often decreases during its formation, and a breakdown below the lower trendline suggests a likely price decline.

E N D
Key Characteristics of the Rising Wedge Pattern Read blog - https://navia.co.in/blog/understanding-rising-wedge-pattern-technical/
Upward-Sloping Trendlines ● ● ● Upper trendline connects higher highs Lower trendline connects higher lows Both slope upwards, but converge to form a wedge Visual cue: The wedge narrows as price moves upward Read blog - https://navia.co.in/blog/understanding-rising-wedge-pattern-technical/
Narrowing Range ● ● ● Price swings become tighter over time Reflects weakening momentum Suggests the market is losing steam before a move Implication: A breakout is likely as pressure builds. Read blog - https://navia.co.in/blog/understanding-rising-wedge-pattern-technical/
Bearish Breakout ● ● ● Breaks below the lower trendline (support) Confirms a reversal to the downside Often used as a bearish signal in uptrends Action Point: Consider short positions post-breakout. Read blog - https://navia.co.in/blog/understanding-rising-wedge-pattern-technical/
Volume Behavior ● ● ● Volume typically declines during the wedge formation Surge in volume at breakout confirms strength Confirms selling pressure taking over Watch for: Volume spike + support break = strong bearish signal Read blog - https://navia.co.in/blog/understanding-rising-wedge-pattern-technical/
Disclaimer Investment in securities market are subject to market risks, read all the related documents carefully before investing. The securities quoted are for illustrative purposes and are not intended as recommendations. Brokerage will not exceed the SEBI prescribed limit. Navia Markets Ltd ,SEBI Registration No.INZ000095034-NSE Member code for CM, FAO & CD: 07708 - BSE Clearing No. for CM, FAO & CD: 6341-MCX Member ID: 45345 NSDL DP ID: IN300378-CDSL DP ID: 12086500-SEBI Registration No. for DP: IN-DP-311-2017-GST Registration number :33AAACM4739R2ZZ-Registered office: Ganga Griha, 4th & 5th Floor, No.9, Nungambakkam High Road, Chennai - 600 034 Email ID: ig@navia.co.in - Contact No: +91 70100 75500 https://bit.ly/naviadisclaimer Read blog - https://navia.co.in/blog/understanding-rising-wedge-pattern-technical/