Gene expression
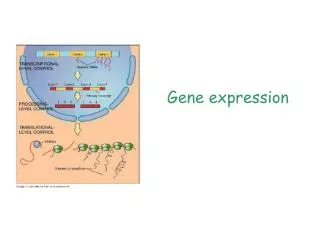
Gene expression. Gene expression. The information encoded in a gene is converted into a protein The genetic information is made available to the cell Phases of gene expression T ranscription 2 . Translation Protein folding Functional protein.

Gene expression
E N D
Presentation Transcript
Gene expression • The information encoded in a gene is converted into a protein • The genetic information is made available to the cell • Phases of gene expression • Transcription 2. Translation • Protein folding Functional protein
DNA’s information is copied into messanger RNA (mRNA) molecule in transcription
mRNA directs synthesis of a protein with amino acid sequence determined by the base sequence of the codons in mRNA Translation
Folded Unfolded • Correct folding of a protein is needed to achieve • functional activity
Transcription: • a mRNA copy of a DNA sequence • is produced • RNA polymerasesmake RNAs • a template strand • mRNA copy has one strand • Beside the coding area also other • sequences are added to mRNA • molecule • Sequence is complementary for DNA • Ts are replaced with uracils, U
mRNA is produced and • processed in the nucleus: 1.Introns are cutted off 2.Methyl cap is added to 5’ end 3.Poly A tail is added to 3’ end 4. Alternative splicing Nucleus Cytoplasm • The ready mRNA molecule is • transported to the cytoplasm
From a mRNA to a protein… • Decoding mRNAs is dependent on transfer RNAs (tRNA) • All tRNAs have similar structure • amino acid part • anticodon part • Anticodon part base pairs with it’s • anticodon structure in mRNA • Amino acid part carries correct amino • acid • tRNAs are needed for recognition and transport Amino acid mRNA
Protein synthesis • Happens in ribosomes in cytoplasm • Ribomes recognize the • initiation codon from mRNA • Elongation of a protein chain • includes three steps main steps
Step 0. mRNA arrives to the ribosome and the ribosome starts to ”read” mRNAs code Step 1. tRNA forms a pair with the corresponding codon in mRNA Step 2. A bond is formed by ribosome between the adjacent amino acids Step 3. The ribosome translocates to the next mRNA codon and the ”used” tRNA is discharged from the ribosome
Previous steps are repeated until the ribosome • arrives to the stop codon • Step 4. • Termination is carried out with the help • of termination factors • the nascent protein is released • ribosome dissociates • mRNA is released • Step 5. • Nascent proteins are folded and • chemically modificated
Protein folding • Proteins folding is dictated by it’s amino acid sequence • 3D structure can be predicted from the aa- sequence • Correct folding is needed for the protein to achieve proper functional properties • “Chaperone-proteins” help in folding process • The function of a protein can be predicted from it’s structure
Expression control • The action of a cell is dependent onit’s proteins • Amount of the proteins are determined by: • Concentration of the RNA • Frequency at which the RNA in translated to the protein • Stability of the protein • Only a small portion of the genes in a cell are expressed • Depends on the cell type, developmentalstage, environmental factors…
Regulation at every stage of gene expression • Control of the transcription initiation is the most important • Different kind of control elements are found • In eukaryotes, control elements are found both inside • and outside the gene area • Most important control element is the promoter • Initiation factors regocnize • Initiation place • Directs binding of the enzymes • needed to produce RNA
Control of the initiation of transcription • 5’ regulatory sequences control the site of • transcription initiation The promoter • RNA polymerase can`t recognisetranscription start sites • Start sites are positioned 25 bp to 3’ direction from a • nucleotide sequence motifcalled theTATA BOX • General transcription factors guide RNA polymerase • to the start site • TFIID-protein binds to TATA BOX • Directs the binding of the RNA polymerase
Other transcription factors are also needed • TFIIA, TFIIB, TFIIE and TFIIH bind close • to the start site • Some transcription factors bind to the RNA polymerase • Critical properties are brought by transcription factor • needed for example to unwind the DNA • Also enhancer are needed for activation of transcription • Are found through out the genome • Binding sites for activators
Studying the Gene Expression • All the proteins in a living cell form a complicate, but • functional system • Before “one gene – one experiment” –approach • DNA microarrays Arrays give possibility to monitor • the activities of thousands of genes simultaneously • Monitoring the gene expression is central for a wide • variety of biological research projects
DNA microarrays: • You comparethe gene expression of two or more • sample groups • An array provides a medium for matching known and • unknown DNA samples Based on complementary pairing! • Phases of the Microarray experiment: • The study is designed carefully • Appropriate gene chip for the study is chosen
3. Chips are fabricated/ordered Making of a DNA chip: Probes, with known identities are attached to the base. Probes are either cDNA probesor oligonucleotide probes. Probes are assortment of the genes of the study’s subject. 4. RNA is isolated from the samples and converted to cDNA 5. Samples are labelled with marker chemical 6. Sample cDNAs are let to form base pairs with probes (complementary paring)
7. The amount of the labelled sample associated with each probe is monitored With this data it is possible to calculate the amount of each mRNA speciesrepresented in the sample Because the identities of the probes are known, identification of the sample RNAs is possible Microarray analysis give a huge amount of data, so the help of the computer experts is really needed!
Sample cells Total RNA Samples are labelled with different fluorescence dues Samples are combined and added to the chip
If the sample contains cDNA with the • complementary sequence to the probe • in a spot, the sample cDNA will attach to it • After the hybridization array is scanned • to find out which probes have bound • cDNA the amount of the sample is • measured • The amount of the bound cDNA is due • to the intensity of the fluorescence • label attached to the probe and scanned
different fluorescence colours were used in the • labelling the samples • Samples can be separated from the plate • Usually green and red colour are used • The end product of an array is a scanned plate with • colourful spots
Interpretation of the results: • If the sample nro1 was labelled with green dye and the sample nro2 with red dye… 1. A Red spot means that the sample nro2 has more cDNA of the gene represented in this spot compared to nro1 2. A Green spot means that the nro 1 has more cDNA of the gene represented in this spot compared to nro2 3. A yellow spot means that the both samples have the same amount of the cDNA of the gene represented in this spot (red + green Yellow)
The intensities got from the array image are quantified • by measuring the average intensity of the spots • The ratio of the florescent intensities for a spot is • interpreted as the ratio of concentrations for it’s • corresponding mRNA in the two samples • Interpreting the array data is challenging • Fluorescence noise • Non specific hybridization • Changes in the detection efficiency • Errors in the laboratory work • A lot of interesting can be obtained quite ”easily”…