Download
1 / 17
190 likes | 243 Views
Learn to interpret satellite images using the visible, infrared, and water vapor channels to analyze clouds, weather systems, and atmospheric conditions. Each type of satellite imagery has strengths and weaknesses for weather forecasting. Understand how to identify features like snow pack, fog, hurricane developments, and more. Utilize satellite products in conjunction with other forecast tools for accurate weather analysis.

E N D
Satellite Interpretation Tutorial and Examples
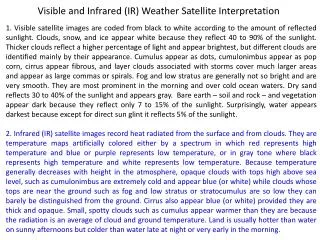
Visible Satellite (VIS) • The visible channel of the satellite measures light using the same wavelengths as the human eye. (In other words, looking at a visible satellite picture is the same as if an astronaut took a photo of the clouds and sent it to you.)
Visible Satellite (VIS) • Objects with higher albedo (ability to reflect sunlight) appear brighter on the satellite image. • Objects with lower albedo appear dark on the satellite image. • Visible satellite is only available during the daylight (the picture to the right shows the west coast still has not seen sunrise yet.)
Visible Satellite (VIS) • Good uses of visible include • Thunderstorm features such as overshooting tops and anvil shadows • Snow cover • Cumulus (most importantly towering cumulus, or TCU) • Fog • Marine Layer clouds • Outflow boundaries from convection • Hurricane features (especially anticyclonic flow aloft) • Fronts, Lows, and other large scale features • Lake effect features • Cirrus streaks (jet stream features)
Visible Satellite (VIS) Can you see the snow pack? Hint: The clouds move, the snow doesn’t. Snowpack L Valley Fog
Infrared Satellite (IR) • Infrared satellite measures radiation output from the earth into space. In other words, it measures temperature and one can infer clouds based on the different temperatures being measured. • The colder an item is, such as a high cloud or a cold air mass, the brighter it is. • The warmer an item is, such as a warm lake or clouds near the ground, the darker it is.
Infrared Satellite (IR) • Often, colored enhancements are added to the pictures to aid in interpretation. This will often allow the user to see more detail. • The user should compare the colors to the color bar (or key) to determine the temperature of the clouds (usually in Kelvin). • The higher the cloud, the colder it is but beware - a very cold air mass or new snow pack can mislead you!
Infrared Satellite (IR) • Good uses of IR include • Nighttime satellite use • Strength/weakness of convection, especially MCS/MCC activity • Approach of cold air masses • Drylines during the afternoon • Cyclone development • Troughs and ridges within the jet stream • Hurricane strength and analysis
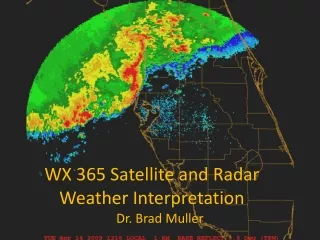
Infrared Satellite (IR) This is an animated gif of hurricane Rita. Notice how the cloud tops warm as the hurricane moves over land and begins to weaken. This shows that the thunderstorm activity is not as strong, as warmer tops mean they are not reaching as high in the atmosphere. The color bar on the bottom of the image correlates to the temperatures of the clouds in Celsius.
Water Vapor Satellite (WV) • Water vapor satellite measures radiation output just as infrared imagery does, but at a different wavelength (a wavelength of radiation that is heavily absorbed by moisture.) • Brighter areas on the images represent greater areas of moisture in the mid and upper levels of the atmosphere. • Darker areas represent drier areas of moisture in the mid and upper levels. • Very cold air can also show up fairly bright, just as in infrared.
Water Vapor Satellite (WV) • Good uses of WV include • Excellent for large scale features such as longwave troughs, ridges, lows, etc. • “Dry intrusions” within a cyclone. • Large scale moisture transport. • Vertical motions (areas of subsidence and rising air.) • Nicely developed shortwave troughs and ridges.
Water Vapor Satellite (WV) Can you see the troughs and ridges? Can you see areas of subsidence or rising air? A shortwave trough is moving through the Dakotas, can you pick it out? Can you see the area of low pressure in Ontario and Quebec? Can you see the overall pattern (the flow) over North America? L Shortwave trough Vertical Ascent L H Subsidence Shortwave ridge Decaying thunderstorms New thunderstorms
Applications of Satellite Products • It is difficult to use just one type of satellite imagery to accurately discern the current weather situation. • Each satellite has strengths and weaknesses. Knowing those will allow you to properly interpret satellite information. • Satellite should never be looked at briefly but examined thoroughly and patiently. • Remember that satellite is only one tool and should be used in conjunction with other forecast products to properly do an analysis.
Applications of Satellite Products This is a visible satellite image of a fairly cloudy regime over the SW US. Can you tell which clouds are low clouds and which clouds are high clouds? Maybe we should compare this to another type of satellite image to help us?
Applications of Satellite Products This is an infrared satellite picture at the same time as the previous slide (the visible pic). Can you see the differences? The clouds off the coast of California and in western Nebraska are much harder to see!
Applications of Satellite Products • Those clouds off the CA coast are the “Marine Layer”. They are very low clouds and basically the same temperature as the ocean below. That is why they don’t show up well on IR. The clouds in the Dakotas and Nebraska also are low, and show up as milky gray on IR. Visible satellite shows them better, but IR allows you to know they are low clouds. • Clouds from Mexico into Texas and Kansas are high cirrus. IR shows you they are higher, especially by using the MB-curve & color enhancement. It is tough to see the difference on visible imagery.
Things you should know (or learn!) • What type of clouds are associated with certain weather patterns (i.e. what clouds to expect in advance of a warm front.) • Marine layer, sea breezes, and other common local weather events often seen on satellite. • At least a basic understanding of troughs, ridges, and the jet stream. • Geography! Know where certain topographical features exist.