Download
1 / 1
10 likes | 122 Views
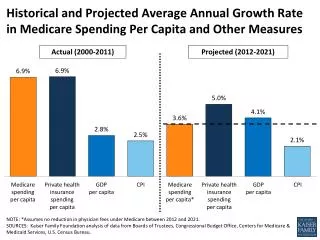
Historical and Projected Average Annual Growth Rate in Medicare Spending Per Capita and Other Measures. Projected (2012-2021). Actual (2000-2011). NOTE: *Assumes no reduction in physician fees under Medicare between 2012 and 2021.

E N D
Historical and Projected Average Annual Growth Rate in Medicare Spending Per Capita and Other Measures Projected (2012-2021) Actual (2000-2011) NOTE: *Assumes no reduction in physician fees under Medicare between 2012 and 2021. SOURCES: Kaiser Family Foundation analysis of data from Boards of Trustees, Congressional Budget Office, Centers for Medicare & Medicaid Services, U.S. Census Bureau.