Download
1 / 45
450 likes | 465 Views
This preliminary report by Simon Milne and Nathaniel Dobbin focuses on enhancing the visitor experience and increasing yield in Cook Islands tourism. It examines visitor characteristics, expectations, expenditure, and economic impacts. The research aims to develop standardized tools that will assist in assessing industry performance.

E N D
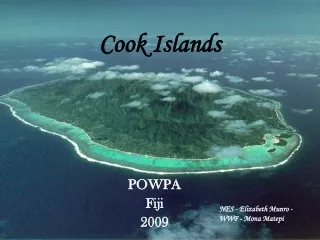
Cook Islands Tourism CorporationVisitor Departure Survey Preliminary report Simon Milne and Nathaniel Dobbin 10 August 2006
HOW TO ??…. ENHANCE VISITOR EXPERIENCE & YIELD BUILD & SUSTAIN PERFORMANCE IMPROVE DECISION MAKING
VISITOR EXPERIENCE YIELD COMMUNITY/BUSINESS INVOLVEMENT AND BENEFIT
PRODUCT QUALITY,COMMUNITY & BUSINESS VITAL INGREDIENTSIN INCREASING YIELDRESEARCH SUPPORTSDECISION-MAKING
Aims of the research • To gain a deeper understanding of the characteristics of visitors to the Cook Islands (decision making processes, demographics etc) • To provide information on the extent to which visitor expectations are met by reality • To determine visitor expenditure • To gather data on the broader economic impacts and experiences of visitors to the outer islands • To develop a set of standardised tools (web-based) that will assist in the creation of a ‘barometer’ of industry performance
Method • Survey period - 11 November to 16 May 2006. • Based on 357 survey responses, covering 757 adults (and an additional 106 children). Currently 500. • Surveyed visitors flew with two airlines, either Air New Zealand or Pacific Blue • 90 % of respondents travelled with Air New Zealand • Web-based survey (flyer at airport)
Basic Characteristics of the Sample(357 respondents) Number of Visits (1 = current trip) Most (71.1 %) are on their first visit to the Cook Islands
Number of visits - New Zealand visitors Number of visits – (other visitors excluding NZ) NZ visitors are more likely to be making a repeat visit than other visitor groups
Age The age profile of the sample is evenly spread across the 19-59 range, there are smaller numbers in the 60+ group
Gender Most respondents are female 63%
Education level attained – total sample Over 70% of those surveyed have some form of tertiary education
Education of New Zealand visitors Education of other visitors The NZ market has a slightly lower education profile than the combined other markets
Average Household Income – Total sample 45.3% have a household income of between $50,000 and 100,000; 28% have a HH income between $100,000 and 150,000 10% have a HH income of greater than $150,000 per year
Country of Origin Almost half of the surveyed visitors come from New Zealand, followed by Australia (21%). This mix differs somewhat from the most recent annual figures for the Cooks (New Zealand- 55 %, Europe 21 %, Australia – 13 %, USA 5 %, Canada 2 %, others 5 %) – this is a reflection of the seasonal nature of this sample.
Travelling with whom A significant percentage of visitors (68.6 %) travel with a partner or spouse.
Number of accompanying the traveller Most of the visitors (49.6%) are accompanied by one person.
Length of stay The average length of stay in Cook Islands for those surveyed is 9.7 days. Most of the visitors (84.9 %) stay either 1 or 2 weeks, around 15% of those surveyed stay longer.
Length of stay of New Zealand visitors Length of stay of other visitors NZ respondents tend to stay a shorter length of time than visitors from other markets
Purpose of visit – total sample The main purpose of visit is holiday making (80.7 %)
Purpose of visit of New Zealand visitors Purpose of visit of other visitors NZ visitors are more likely to be travelling for other reasons
Visited Islands Most visitors stay in Rarotonga, followed by Aitutaki
Sources used in trip planning (importance) In planning the trip the most important sources are internet and word of mouth.
Sources of information for trip planning - New Zealand visitors Sources of information for trip planning - other visitors Non-NZ visitors are particularly reliant on the internet as a resource in planning their trip, those from NZ are more reliant on word of mouth.
Satisfaction with tourism product (1 = low, 5 = highest) The survey reveals high overall levels of satisfaction – with the friendliness of people met ranking highest, the cost of accommodation lowest.
Visitor Satisfaction Visitors tended to express satisfaction with the overall experience rather than specific elements…… “Where do I start? We thoroughly enjoyed every aspect of our holiday … the whole experience was wonderful and we can’t wait to go back again. We have recommended the islands as a great holiday destination to all our friends.”
Visitor Satisfaction More than 87% respondents said “Yes” when asked about re-visiting the Cook Island. 98% of respondents said they would recommend a holiday in the Cook Islands to their friends.
Most appealing aspects of the Cook Islands experience The most appealing elements of the Cook Islands experience are friendly people, scenery and environment. Interestingly ‘local culture’ does not feature greatly. Visitor Satisfaction
Visitor Satisfaction Some visitors comments: “The beaches are exactly what they look like in the photos. It’s the best experience of my life, it’s my first trip overseas, I would definitely go back there”. “Very laid back, friendly locals/staff that made this the ‘easiest’ holiday we have had. MUCH better than Tahiti!” “We absolutely loved the people of the Cook Islands – you are heart people… What a WONDERFUL culture you share with the outside world… it’s not a ‘Hollywood’ version of what others think island life should be – you share what is real with us ‘visitor’… and that is really wonderful!”
Least appealing aspect of the Cook Islands experience Visitor Satisfaction Note that only 314 out of 357 completed the question. None of these factors were listed by more than 20% of respondents.
The factor that concerns, and even annoys, a lot of respondents is what they see as relatively weak protection of the environment. Some comments of visitors: “No recycling program, garbage not picked up around the island. Didn’t enjoy having my fingers nipped by dogs while I was walking on the beach”. “…. I would hate for it to become anything like Hawaii. What you have is very special and it should be protected and kept the way it is.” “We were very disappointed to see that people were encouraged to walk on the reef… and were shocked to realise that tourists could actually take home two pieces of coral or shells by simply getting a $10.00 permit…”
Price and costs are becoming a negative issue for some: “The cost of accommodation and food. This is my 2nd visit the last one was 1 year ago. I thought it was relatively expensive then but now I feel it has become uncomfortably expensive. This is reflected in the fact that we did not go on any excursions, lagoon tours etc.” “Prices are beginning to creep up. This is our 5th trip. Exchange rate aside, it seems that some local businesses are attempting to over-price some items that used to be a true bargain.” “Guides did not know enough about specific subjects, ie. birds mineral, rocks, formations of the island.” “The people in the shops were rude and unobliging… The hotel staff were acting as if we wanted their souls, when we asked about the Island Night. The staff at the hotel were the friendliest of all… If it was not for them we would have really hated the whole experience. Will not coming back, Fiji out ranks Raro no end sorry.”
Table. 3 Possible improvements to the Cook Islands experience Only 206 out of 357 respondents completed the question. The most frequent suggestions are better facilities/service/more friendly staff, improved environment maintenance, price control and better routes/time schedules for flights.
Visitor suggestions for improvements: “Improve the image of the main shopping centre. Improve the roads and provide footpaths on one side of the road for the safety of walkers and children…” Other suggestions range from lower prices, better facilities ( Internet access, information access, road signs, public transportation, etc), better preservation of the islands (“keep the island as it is”), more activities and better customer service. “keep it natural please don’t get too many resorts, we love it just the way it is… just keep the standard up of what you have… The atmosphere, plus other factors, is thought to give the islands a competitive advantage over their major competitors…”
Visitor expenditure in the Cook Islands (per person per day) (n=757)
Visitor Expenditure Total spend per adult visitor per day is $164. Most people visit the Cooks in groups of 2 or more – thus the average spend for a couple would be $328 per day. We have attempted to gain a sense of pre-paid accommodation in the survey but we estimate that other prepaid costs (transfers, meals, etc) add at least a further 15% to these figures. Thus the total daily spend is likely to be in the range of $190 per day – with most of the extra flowing to accommodation and transport.
Average expenditure per visitor per day by country of origin There is relatively limited variation in spend per day across nationalities but sample sizes for non-NZ markets are still quite small at this point.
THE ECONOMIC IMPACT OF TOURISM IN SPTO MEMBER COUNTRIES AUGUST 2005
Economic Linkages Comparing trends in local supply purchases (by country)
WHERE TO FROM HERE…..? • Highlights some critical issues for the Cook Islands • Value of on-going data collection (barometer) • Developing a research program that is cost effective and can be locally run • Sponsorship and support (logistical and financial) • Raising awareness and support from business/community