Download
1 / 40
410 likes | 604 Views
The physiology of the BOLD signal. Klaas Enno Stephan Laboratory for Social and Neural Systems Research Institute for Empirical Research in Economics University of Zurich Functional Imaging Laboratory (FIL) Wellcome Trust Centre for Neuroimaging University College London.

E N D
The physiology of the BOLD signal Klaas Enno Stephan Laboratory for Social and Neural Systems Research Institute for Empirical Research in Economics University of Zurich Functional Imaging Laboratory (FIL) Wellcome Trust Centre for Neuroimaging University College London With many thanks for slides & images to: Meike Grol Tobias Sommer Ralf Deichmann Methods & models for fMRI data analysis18 February 2009
Ultrashort introduction to MRI physics • Step 1: Place an object/subject in a big magnet • Step 2: Apply radio waves • Step 3: Measure emitted radio waves
Step 1: Place subject in a big magnet When you put any material in an MRI scanner, the protons align with the direction of the magnetic field. Protons have “spins” (like gyroscopes). They have an orientation and a frequency. Images: www.fmri4newbies.com
T1 T2 Step 2: Apply radio waves When you apply radio waves (RF pulse) at the appropriate frequency (Larmor frequency), you can change the orientation of the spins as the protons absorb energy. After you turn off the RF pulse, as the protons return to their original orientations, they emit energy in the form of radio waves. Images: Ralf Deichmann
T2 = time constant of how quickly the protons emit energy when recovering to equilibrium T1 = time constant of how quickly the protons realign with the magnetic field fat has low signal dark fat has high signal bright CSF has high signal bright CSF has low signal dark T1-WEIGHTED ANATOMICAL IMAGE T2-WEIGHTED ANATOMICAL IMAGE Step 3: Measure emitted radio waves Images: fmri4newbies.com
T2* weighted images • Two factors contribute to the decay of transverse magnetization:1) molecular interactions2) local inhomogeneities of the magnetic field • The combined time constant is called T2*. • fMRI uses acquisition techniques (e.g. EPI) that are sensitive to changes in T2*. • The general principle of MRI: • excite spins in static field by RF pulses & detect the emitted RF • use an acquisition technique that is sensitive to local differences in T1, T2 or T2* • construct a spatial image
Functional MRI (fMRI) • Uses echo planar imaging (EPI) for fast acquisition of T2*-weighted images. • Spatial resolution: • 3 mm (standard 1.5 T scanner) • < 200 μm (high-field systems) • Sampling speed: • 1 slice: 50-100 ms • Problems: • distortion and signal dropouts in certain regions • sensitive to head motion of subjects during scanning • Requires spatial pre-processing and statistical analysis. EPI (T2*) dropout T1 But what is it that makes T2* weighted images “functional”?
The BOLD contrast BOLD (Blood Oxygenation Level Dependent) contrast = measures inhomogeneities in the magnetic field due to changes in the level of O2 in the blood Oxygenated hemoglobine: Diamagnetic (non-magnetic) No signal loss… B0 Deoxygenated hemoglobine: Paramagnetic (magnetic) signal loss ! Images: Huettel, Song & McCarthy 2004, Functional Magnetic Resonance Imaging
The BOLD contrast deoxy-Hb/oxy-Hb rCBF ? ? neurovascularcoupling neuronal metabolism synaptic activity D’Esposito et al. 2003 Due to an over-compensatory increase of rCBF, increased neural activity decreases the relative amount of deoxy-Hb higher T2* signal intensity
The BOLD contrast REST • neural activity blood flow oxyhemoglobin T2* MR signal ACTIVITY Source: Jorge Jovicich, fMRIB Brief Introduction to fMRI
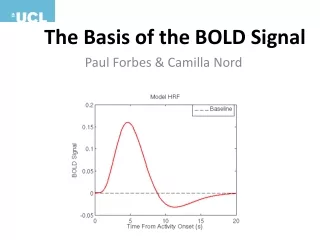
Peak Brief Stimulus Undershoot Initial Undershoot The temporal properties of the BOLD signal • sometimes shows initial undershoot • peaks after 4-6 secs • back to baseline after approx. 30 secs • can vary between regions and subjects
u stimulus functions neural state equation t hemodynamic state equations Balloon model BOLD signal change equation BOLD signal is a nonlinear function of rCBF Stephan et al. 2007, NeuroImage
Three important questions • Is the BOLD signal more strongly related to neuronal action potentials or to local field potentials (LFP)? • How does the BOLD signal reflect the energy demands of the brain? • What does a negative BOLD signal mean?
Neurophysiological basis of the BOLD signal: soma or synapse?
BOLD & action potentials Red curve: “average firing rate in monkey V1, as a function of contrast, estimated from a large database of microelectrode recordings (333 neurons).” Heeger et al. 2000, Nat. Neurosci. Rees et al. 2000, Nat. Neurosci. In early experiments comparing human BOLD signals and monkey electrophysiological data, BOLD signals were found to be correlated with action potentials.
Action potentials vs. postsynaptic activity Local Field Potentials (LFP) • reflect summation of post-synaptic potentials Multi-Unit Activity (MUA) • reflects action potentials/spiking Logothetis et al. (2001) • combined BOLD fMRI and electrophysiological recordings • found thatBOLD activity is more closely related to LFPs than MUA Logothetis et al., 2001, Nature
BOLD & LFPs blue: LFP red: BOLD grey: predicted BOLD Logothetis & Wandell 2004, Ann. Rev. Physiol.
Dissociation between action potentials and rCBF • GABAA antagonist picrotoxine increased spiking activity without increase in rCBF... • ... and without disturbing neurovascular coupling per se rCBF-increase can be independent from spiking activity, but seems to be always correlated to LFPs Thomsen et al. 2004, J. Physiol. Lauritzen et al. 2003
Current conclusion: BOLD signal seems to be more strongly correlated to postsynaptic activity BOLD seems to reflect the input to a neuronal population as well as its intrinsic processing. Lauritzen 2005, Nat. Neurosci. Rev.
Three important questions • Is the BOLD signal more strongly related to neuronal action potentials or to local field potentials (LFP)? • How does the BOLD signal reflect the energy demands of the brain? • What does a negative BOLD signal mean?
Is the BOLD signal driven by energy demands or synaptic processes? deoxy-Hb/oxy-Hb rCBF ? ? neurovascularcoupling neuronal metabolism synaptic activity D’Esposito et al. 2003
Localisation of neuronal energy consumption Salt loading in rats and 2-deoxyglucose mapping → glucose utilization in the posterior pituitary but not in paraventricular and supraoptic nuclei (which release ADH & oxytocin at their axonal endings in the post. pituitary) → neuronal energy consumption takes place at the synapses, not at the cell body Compatible with findings on BOLD relation to LFPs! But does not tell us whether BOLD induction is due to energy demands or feedforward synaptic processes... Schwartz et al. 1979, Science
Lack of energy? • Initial dip: possible to get more O2 from the blood without increasing rCBF (which happens later in time). • No compensatory increase in blood flow during hypoxia (Mintun et al. 2001). Friston et al. 2000, NeuroImage rCBF map during visual stimulation under normal conditions rCBF map during visual stimulation under hypoxia Mintun et al. 2001, PNAS
Lack of energy? • Sustained visual stimulation is associated with an increase in rCBF far in excess of O2 consumption. But over time, O2 consumption begins to increase as blood flow falls (Mintun et al. 2002). Mintun et al. 2002, NeuroImage Blood flow seems to be controlled by other factors than a lack of energy.
Blood flow might be directly driven by excitatory postsynaptic processes
Glutamatergic synapses: A feedforward system for eliciting the BOLD signal? Lauritzen 2005, Nat. Neurosci. Rev.
Forward control of blood flow Courtesy: Marieke Scholvinck
O2 levels determine whether synaptic activity leads to arteriolar vasodilation or vasoconstriction Gordon et al. 2008, Nature
Energetic consequences of postsynaptic activity ATP needed for restoring ionic gradients, transmitter reuptake etc. Glutamate reuptake by astrocytes triggers glucose metabolism Attwell & Iadecola 2002, TINS. Courtesy: Tobias Sommer
Three important questions • Is the BOLD signal more strongly related to neuronal action potentials or to local field potentials (LFP)? • How does the BOLD signal reflect the energy demands of the brain? • What does a negative BOLD signal mean?
Negative BOLD is correlated with decreases in LFPs positive BOLD positive BOLD Shmuel et al. 2006, Nat. Neurosci.
Impact of inhibitory postsynaptic potentials (IPSPs) on blood flow Lauritzen 2005, Nat. Neurosci. Rev.
Negative BOLD signals due to IPSPs? Lauritzen 2005, Nat. Neurosci. Rev.
Potential physiological influences on BOLD cerebrovascular disease structural lesions (compression) blood flow medications autoregulation (vasodilation) blood volume hypoxia volume status BOLD contrast hypercapnia biophysical effects anesthesia/sleep anemia smoking oxygen utilization degenerative disease
Drug effects Coronary heart disease Analgetics (NSAIDs)
Summary • The BOLD signal seems to be more strongly related to LFPs than to spiking activity. • The BOLD signal seems to reflect the input to a neuronal population as well as its intrinsic processing, not the outputs from that population. • Blood flow seems to be controlled in a forward fashion by postsynaptic processes leading to the release of vasodilators. • Negative BOLD signals may result from IPSPs. • Various drugs can interfere with the BOLD response.
MRI physics in a nutshell - I • Inside static magnetic field:Spins of protons align with magnetic field B longitudinal magnetisation (because spins carry an elementary magnetisation) • Intended manipulation:Make spins rotate (precess) about the direction of B (like a gyroscope). • Precession (Lamor) frequency is proportional to B, e.g. 64 MHz for 1.5 T B
MRI physics in a nutshell - II • How do we do it?RF pulses (Larmor frequency!) push M away from B transverse magnetization • During precession, each proton emits an RF signal. • After the RF pulse, M will re-align to B within 2-3 secs “relaxation” • Relaxation has a longitudinal (T1) and a transverse (T2) component tissue-dependent time constants! T1 T2
MRI physics in a nutshell - III • Two factors contribute to the decay of transverse magnetization:1) molecular interactions2) local inhomogeneities of the magnetic field→ leads to dephasing of the spins • The combined time constant is called T2*. fMRI uses acquisition techniques (e.g. EPI) that are sensitive to changes in T2*. • The general principle of MRI: • excite spins in static field by RF pulses & detect the emitted RF • use an acquisition technique that is sensitive to local differences in T1, T2 or T2* • construct a spatial image (“how” is the topic of a different talk)